
 Dacity Coin
 Injective
 Pearl
Pearl Bittensor
 Pudgy Penguins
 Celestia
 NEAR Protocol
- The GTC stock price is trading at 8.58 GBX.
- The sellers are currently dominating the price.
Getech Group (LSE: GTC) was founded in 1986 by J. Derek Fairhead. The company provides expertise, support, and knowledge for companies and governments regarding the discovery, development, and management of natural resources. The firm operates through the following segments: Products and Services. It also provides data-rich products, GIS solutions, and trusted advisory services.
Getech Group (GTC) Stock: Financial Analysis
Getech Group’s revenue in 2020 was around 3.56 Million GBP. In 2021, the company generated a revenue of 4.28 Million GBP with a growth of 20.12% compared to the previous year. In 2022, it increased its revenue to 5.07 Million GBP with a growth of 18.46%. The trailing twelve months (TTM) revenue for 2023 is running at 5.07 Million GBP which is the same as the previous year’s revenue.
The company’s net income has been consistently poor over the three years. The company’s net income value has been increasing in negative terms. In 2020, its net income was -1.64 Million GBP, in 2021 its net income was -1.95 GBP Million and in 2022 its net income was -2.83 Million GBP.
The company has managed to decrease its total debts over the last three years from 1.24 Million GBP in 2020 to 989K GBP in 2021 to 847K GBP in 2022. The firm does not pay any dividends to its shareholders.
The Getech Group has been able to generate and increase its revenue consistently over the last three years. The company has managed to decrease its total debts. However, it has a negative net income which has consistently increased negatively. The overall finances of the company are doing well but the increasingly negative net income could be bad for the company.
Getech Group (GTC) Stock: Technical Analysis
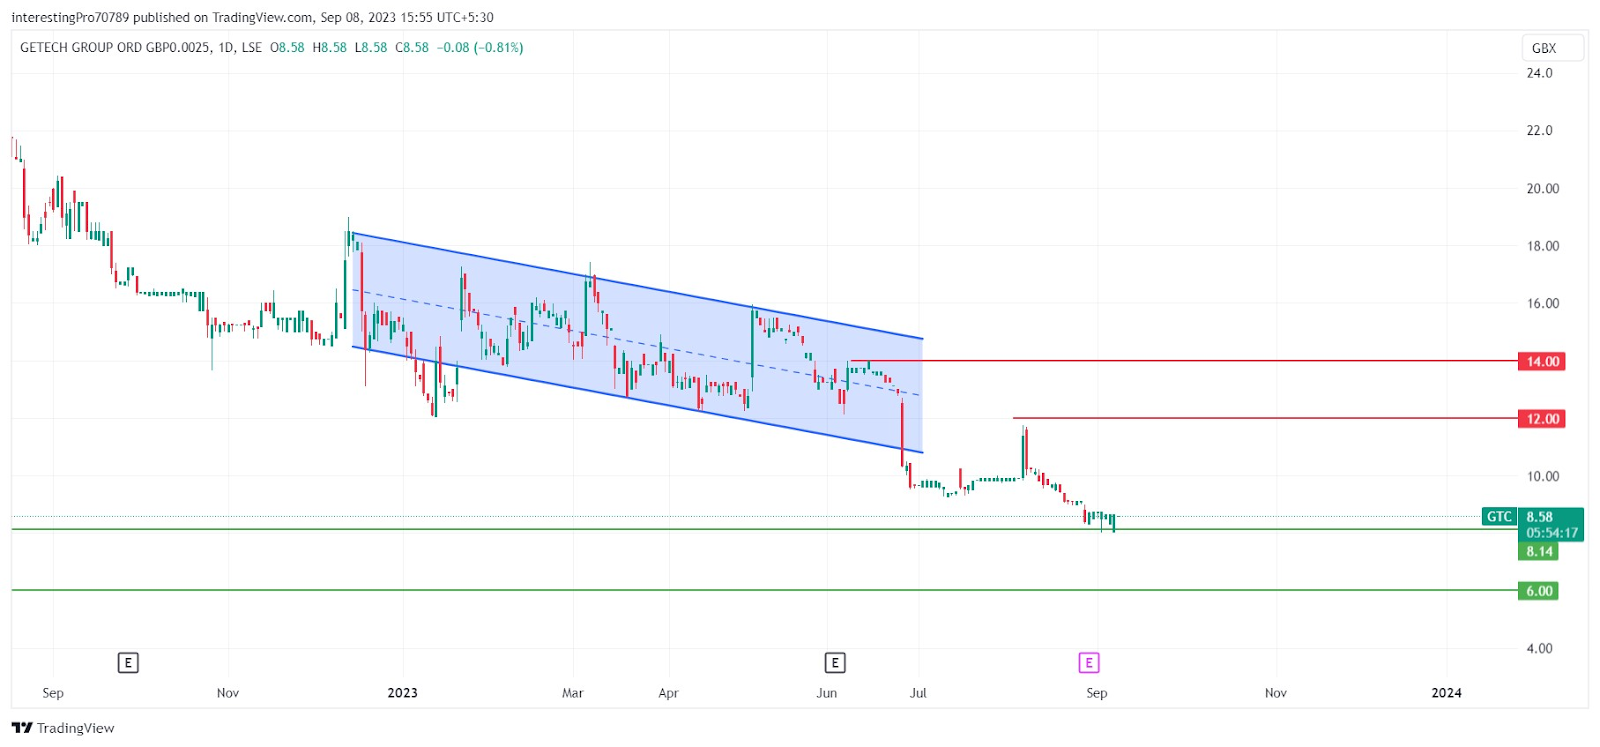
In December 2022, the GTC stock price after reaching to 19 GBX faced rejection from there and was seen falling. The price fell 14 GBX and tried to sustain above it. but in January 2023, the price gave a breakdown of 14 GBX and started to fall. But it faced immediate rejection and reclaimed 14 GBX and started to trade above it.
Afterward, the price was seen trading inside a falling parallel channel. In June 2023, the price gave the breakdown of the parallel channel and started to fall. The price fell to 9.40 GBX and showed a slight pullback showing that it went back inside the parallel channel. When it reached 12 GBX it faced rejection and fell to its historical support at 8.14 GBX.
Currently, the price is trading at its support of 8.14 GBX and is sustaining above it. If the price gives the breakdown of the support then it may fall to its next support at 6.00 GBX. However, for the price to commence a bullish rally, it must sustain above the $8.14 support and form a strong bullish candle after which it can rise up to 12 GBX.
Technical Indicators’ Prediction About the Current Trend
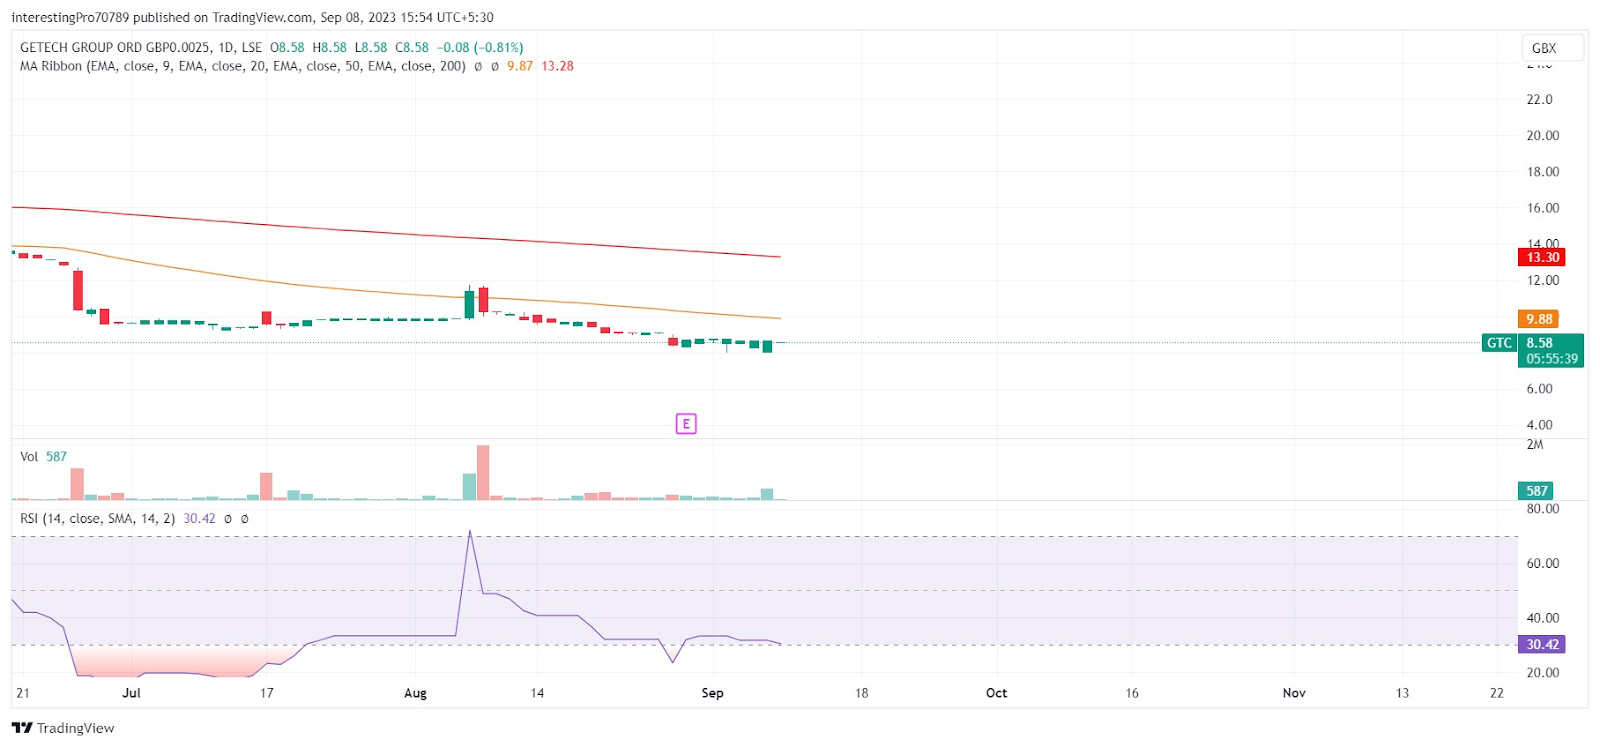
The GTC price is currently trading below the 50 and 200 EMAs, which indicates the bearish sentiment over the price.
The relative strength index (RSI) is at 30.42. The RSI indicates the sellers’ control over the price.
Conclusion
The GTC stock price is witnessing bearish sentiments at the time of writing. The price is trading at its 8.14 GBX support level. If the price gives the breakdown of the support, then it may fall to its next support at 6.00 GBX. However, for the price to commence a bullish rally it must have sustained above the $8.14 support and formed a strong bullish candle, after which it can rise up to 12 GBX.
Technical levels
Resistance levels: 12 GBX.
Support levels: 8.14 GBX and 6.00 GBX.
Disclaimer
The views and opinions stated by the author, or any people named in this article, are for informational purposes only. They do not establish financial, investment, or other advice. Investing in or trading crypto assets comes with a risk of financial loss.



