
 Minter
 Quack AI
 STONK
STONK Pons
Pons Sui
Sui Pearl
Pearl Bittensor
· Bank of America Corporation, Inc.’s (BAC) stock is moving inside a descending triangle pattern.
· Bank of America Corporation, Inc.’s dividend yield is 5.33%.
Bank of America Corporation is a bank and financial services company. The company was founded in 1904 in Charlotte, New Carolina.
Bank of America Corporation, Inc. (NYSE: BAC) stock is currently showing signs of uncertain momentum.

Bank of America Corporation, Inc.’s stock is currently trading at $29.08, which reflects an increase of 2.09% in today’s market session. The current market price is $21.80. The stock’s market cap has shown a rise of 8.8% YoY.
The dividend payout ratio of Bank of America is 25.33%, and the dividend yield (TTM) is 3.16%. The company pays 25.3% of its earnings as a dividend.
The net income of Bank of America has increased by 18% YoY. The current net income for Q2 2023 is $7.4 Billion. The earnings have increased in this quarter, which is a positive sign.
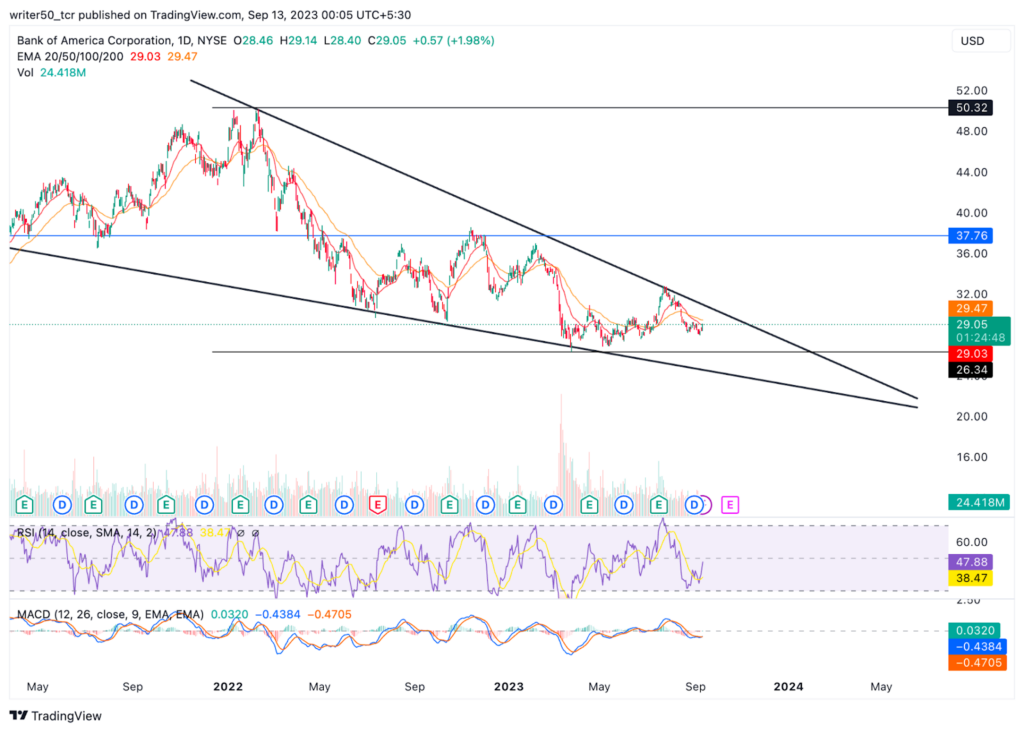
BAC stock hit an all-time high of $50.11 in February 2022; immediately after this, the stock price started declining. The stock price has dropped almost 47% since then. However, the price took support at the $29 level. The price movement of BAC stock has formed a descending triangle pattern. The price is consolidating within a region and further movement can only be predicted if the price gives a breakout in any direction.
Bank of America Corporation, Inc.’s stock has declined almost 18% in one year. The stock is making an uncertain pattern as per the current market scenario.
When looking at the news headlines, we find that the BAC has reduced the investment banking fees for Q3.
Bank of America Corporation (BAC) Stock Price Analysis
Technical Indicators Overview
The BAC stock price is currently trading under both the 50-day and 100-day EMAs, and there is a bearish crossover happening among the EMAs, which is seen as a bearish sign.
Moreover, the RSI line has reached the oversold zone and is staying there, confirming the negative sentiments around the stock.
Conclusion
In conclusion, BAC stock has shown a downward movement in the past year. Currently, the price is taking a rest near the support level. Further price prediction will be possible only once there is a breakout in any direction.
Technical Levels
Support Level: $29.03
Resistance Level: $37
Disclaimer
The views and opinions of the author or anyone in this article are for informational purposes only. They do not offer financial, investment, or other advice. Investing in or trading crypto assets involves the risk of financial loss.




