
 Boomer
 Covenant x402
 Pearl
Pearl Claudia
 Solana
 Bitcoin
 Quantus
- The Target Corporation stock price has declined by 21.53% in the last six months.
- The company was founded in 1902. It runs a chain of hypermarkets and discount department stores.
The TGT stock price has declined by -0.82% during the last trading session resulting in a CMP of $122.67. This stock has a PE ratio of 16.97 and an EPS of 7.32 USD. It represents that the company is profitable and makes $7.32 on each share.
Target Corporation has 461.605 Million shares floating in the market available for trading, leading to a market cap of $56.625 Billion. It has a debt/equity ratio of 157.05%, which is good for the firm. The P/B ratio of the company is 4.72 and it is also a good figure for the future performance of the company.
The current ratio of the company is 0.83. It shows the company is not capable enough to pay its debt in the future. The operating cycle of the company is 58.01 days and the days of payables outstanding is 56.15. The operating free cash flow of the company has advanced by +58.4% year-on-year. That is a good sign for the company, but the financial ratios are not favorable. These can cause troubles in the financial performance of the company.
Target Corporation Performance Analysis
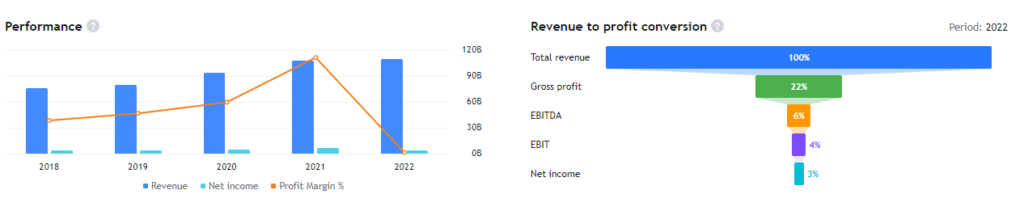
Target Corporation has made a revenue of $109.12 Billion in the year 2022. Its revenue was $106.00 Billion in the year 2021. The net income of the company has declined by $4.17 Billion as compared to the previous year. This company’s debt has also increased from $16.47 Billion to $20.67 Billion. The net income of the company is only 3% of the total revenue.
TGT Technical Analysis
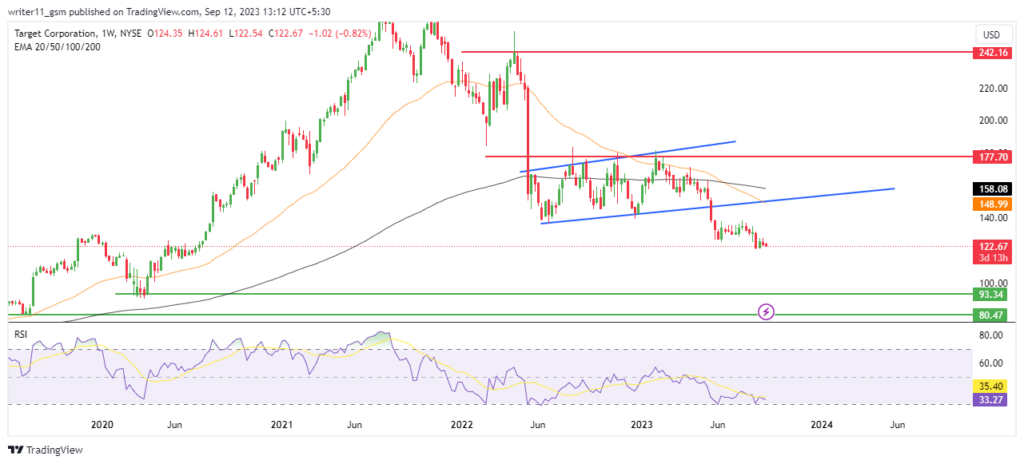
The price of the TGT stock has broken down below the inverted flag and pole pattern. It was formed during the consistent decline of price, making a lower low-swing structure. The price can continue to the lower support levels.
Due to a consistent decline in the price for a very long time, the market has been following a preceding death cross of the EMAs. It is leading the market to further lower levels.
The RSI for the TGT share is trading below the 50 level. It has also dipped below the oversold zones. This behavior of the RSI represents a weakness in the market and the presence of sellers.
Technical Overview of Target Corporation Stock
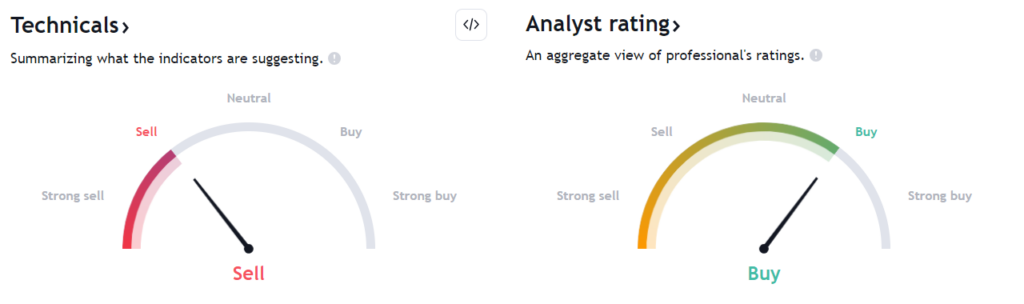
Based upon the daily timeframe of the TGT stock, multiple indicators such as oscillators and the EMAs are bearish on charts. Experts and analysts are bullish on the charts based on the fundamentals of the stock. It indicates uncertainty in the TGT share price.
Conclusion
The TGT share price has been consistently declining and has broken down below the inverted flag and pole pattern. The indicators are also bearish and support a further price decline.
Therefore, the stock value is expected to decline further. It can hit the support levels!
Technical Levels
- The support levels for TGT Stock are – $80.50 and $93.30
- The resistance levels for TGT stock are – $177.00 and $242.00
Disclaimer
The information provided in this article, including the views and opinions expressed by the author or any individuals mentioned, is intended for informational purposes only. It is important to note that the article does not provide financial or investment advice. Investing or trading in cryptocurrency assets carries inherent risks and can result in financial loss.




