
 Celestia
 Starknet
 Quantus
 NEAR Protocol
 Pump.fun
 Hyperliquid
 LayerZero
· Visa Inc. stock is trading at $241.07
· V stock has given a 21.7% return in the previous year.
· Visa, Inc. has a revenue of $29.3 Billion.
The Visa Inc. functions as a global payments technology firm. Their main service, VisaNet, serves as a transaction processing network, facilitating the approval, clearing, and completion of payment transactions worldwide.
The stock of Visa Inc. (V) is currently showing signs of an upward trend. It’s notable that the price of V is creating a pattern of higher highs, indicating a strong bullish pattern in the stock.
Financial Data of Visa Inc. (NYSE: V)
V stock is trading at $241.07. The stock has a share float of $1.60 Billion. The stock value is $490.6 Billion.
Over the last six months, the price of Visa Inc. (V) stock has experienced a notable increase of 12.19%, clearly signaling its current upward momentum.
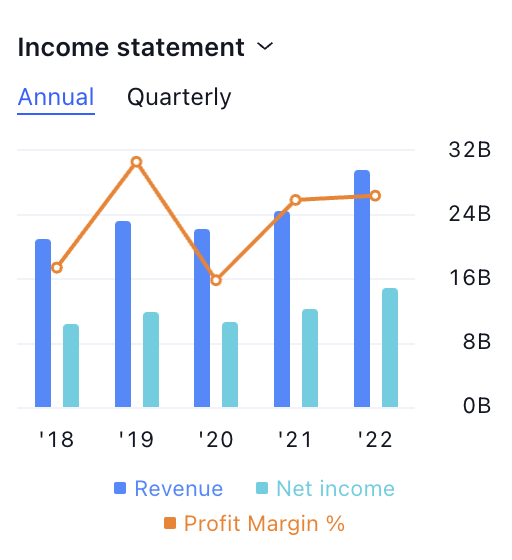
Additionally, V stock shows substantial growth in its quarterly profit margin and net income, further underlining its positive financial trajectory.
In terms of valuation, V stock carries a P/E ratio of 31.8, suggesting that its current stock price is in line with fair value.
Back in July 2021, the stock price reached a peak at $252.67. Following that, it began a gradual decline, ultimately dropping by approximately 31% by the end of October 2022, and settling at $174. However, a rebound ensued, kickstarting an upward trend. As of today, the price has made a noteworthy recovery of 43%.
Presently, the price shows a pattern resembling a rising wedge, indicating the potential for a breakthrough above the support level and the chance to establish new record highs.
V stock has a dividend payout ratio of 22.28% and a dividend yield of 0.75%. The company pays a timely dividend to its shareholders.
Visa Inc. (V) Technical Analysis
v by writer50_tcr on TradingView.com
Visa Inc.’s stock price is currently positioned above both the 50-day and 100-day EMA levels. This signifies strength in the V stock price, which is seen as a positive sign for potential price increases.
Examining the technical indicators, we find that the MACD line for V stock is trading higher than the signal line, and there’s a presence of a green histogram. These factors collectively suggest a bullish sentiment in the stock price, hinting at the possibility of price gains in the coming days.
The RSI line for V stock is notably robust, hovering close to the 70 level. This signifies a favorable outlook, and it is anticipated that the price will experience further upward movement in the future.
Conclusion
In conclusion, Visa Inc. (V) stock has made a notable breakout from a triangle pattern, reflecting a positive momentum overall. Over the past year, the V stock price has shown a commendable increase of 21.70%. Additionally, both the EMA and MACD indicators are pointing toward a growing momentum.
All these indicators collectively suggest that there’s a likelihood of the price continuing its upward trajectory in the future.
Technical Levels
· Support Level: $234
· Resistance: $233
Disclaimer
The views and opinions of the author, or anyone named in this article, are for informational purposes only. They do not offer financial, investment, or other advice. Investing or trading crypto assets involves the risk of financial loss.




