
 Minter
 Bittensor
 Quack AI
 NEAR Protocol
 Pons
Pons Pearl
Pearl Bitcoin
- Montauk Renewables Inc. is an American company with fully integrated renewable energy management. It converts biogas into renewable energy.
- The MNTK stock is listed on the National Association of Securities Dealers Automated Quotations (NASDAQ).
- The company was founded in 1980. It is owned 16.29% by institutional investors, 43.67% by MNTK insiders, and 40.40% by retail individual investors.
MNTK’s is Return On Equity (ROE) is 14% as compared to the industry average. In the last 5 years, significant 28% growth in the net income of the company.
Technical Analysis of the MNTK Stock
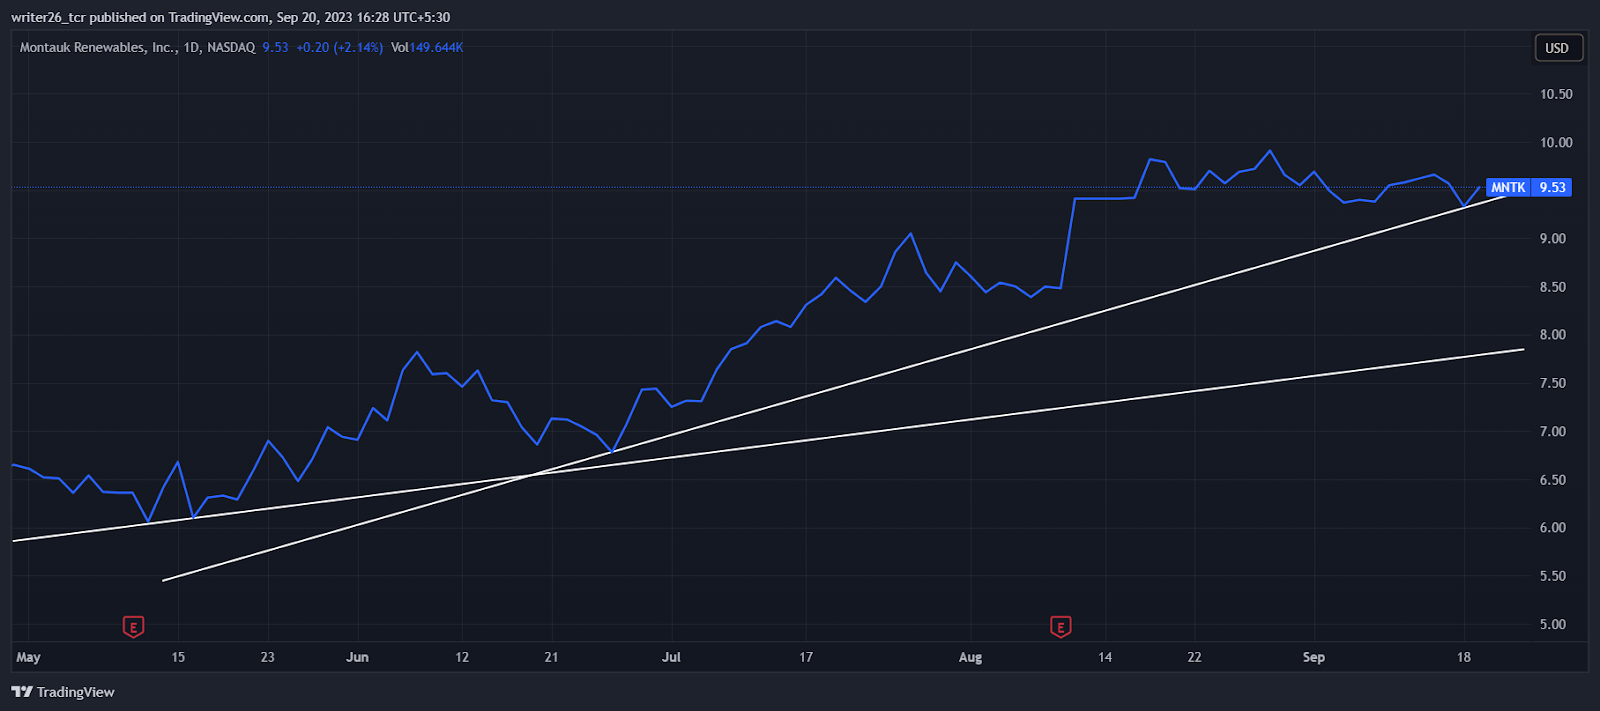
Source: NASDAQ: MNTK by Trading View
In the daily time frame, the stock is in an uptrend. It made multiple support points near the current market price.
The trendline might act as a strong line and the stock might continue its upward movement in the future.
The price share of the MTNK stock in 2022 (year-end) was around $11.11. In 2023, the current market price of Cost is $9.53. It decreased by $1.58 in 9 months.
In today’s trading session, it was up by 2.14% which means it went up by $0.20 in a single day.
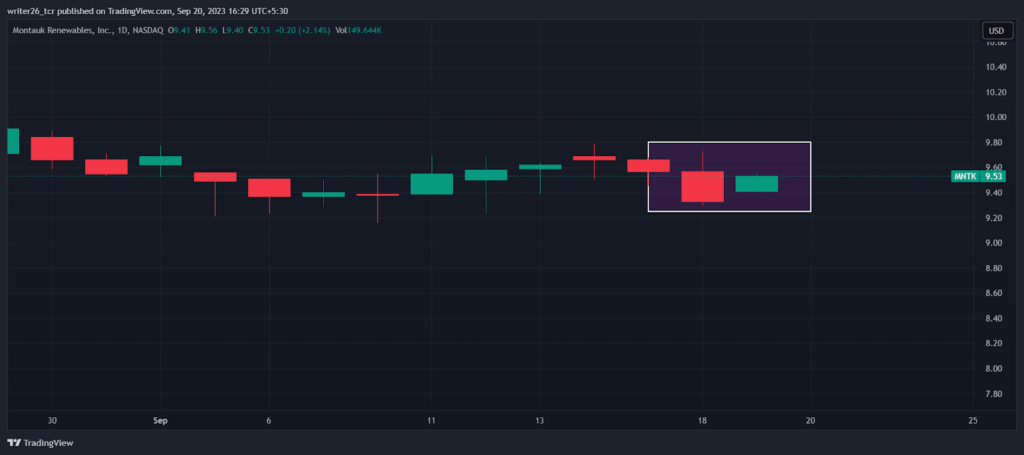
The pattern in the rectangle is known as “Bullish Harami”. It indicates that the bulls are trying to push stock in the up direction.
The previous day was controlled by bears, so today bulls tried to control the market.
This pattern confirms that the bear trend will end after the formation of a “Bullish Harami”.
According to forecasts, the price might rise by 3.25% which means it might go up to a $9.84 price level by 25 September 2023.
The current market sentiments are bullish. It recorded 16/30 green days in the last 30 days which is around 53%.
The F&I index (Fear & Greed Index) is showing 39 (Fear) and the price volatility was 5.56% over the last 30 days.
Should You Buy the MNTK Stock?
The MNTK stock is currently a good buy because the price might increase by 29.73% in the next year.
Live chart of MNTK
Conclusion
Through the evaluation of the stock with the help of technical analysis, we can say that overall the stock is in a downtrend position.
In the monthly time frame, it was in a sideways position which is not good for long-term investment. it is moving in the same manner In the weekly time frame as it was in the monthly time frame. In the daily time frame, it is in uptrend. Overall it is in an uptrend and in all time frames it is sideways only except the daily time frame.
So the stock does have the potential to generate a good amount of returns on the investment made by the general public in the yearly and monthly time frame. The prices might go up as it is continuously in an uptrend. The stock has provided great ROI to its investors.
Technical Levels
Resistance Level- $11.71
Support Level- $6.08
Disclaimer
The views and opinions of the author or anyone in this article are for informational purposes only. They do not offer financial, investment, or other advice. Investing in or trading crypto assets involves the risk of financial loss.




