
 Dacity Coin
 astronaut
 Celestia
 Injective
 Bittensor
 Quantus
 Pearl
Pearl
- The FXS token’s price has escalated by over 8% in a week.
- The FXS coin price has been consolidating for more than 3 months.
- FXS token’s price has cleared out the resistance level of $5.5.
Market capital of the FXS’s Coin – $427.321 Million
The current market price of FXS’s coin – $5.763
The FXS Coin Price Overview
FXS token is trading with an upside of $0.125, a rise of 2.22% from its previous trading session. The price has surged by over 8% in a week, which signifies that the buyers are taking control of the price. However, the coin price has declined merely by 1.27% in a month. It indicates that both buyers and sellers have failed to dominate the price in this period.
The FXS coin’s price has broken the resistance level, which was present near the level of $5.50. It is showing some strength near the levels of $5 – $4.5.
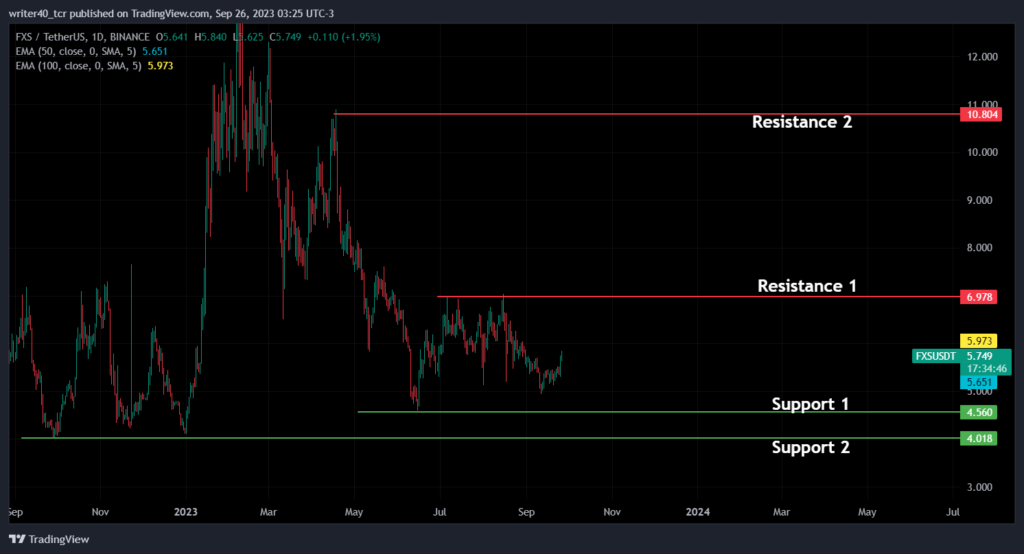
FXS coin’s price has been consolidating for so long between the level of $7 and $4.5. It has melted down by over 87% from its all-time high, which was created in January 2022.
Technical Analysis of the FXS Coin
The price is currently trading in a range of $7 and $4.5. FXS coin’s price is facing rejection from the level of $7. The level has been tested twice till now. This level has been marked as Resistance 1 on the chart given below. The Token is creating a strong demand from the levels of $5 and $4.5, which indicates that the buyers are present there.
The support zone for the coin is present near the level of $4.5. It is marked as the support 1 on the chart. The previous support zone from where the price can bounce is present near the level of $4.018. It has been marked as support 2 on the chart. FXS coin’s price can also face some rejection near the level of $10.804, which is marked as Resistance 2 on the chart.
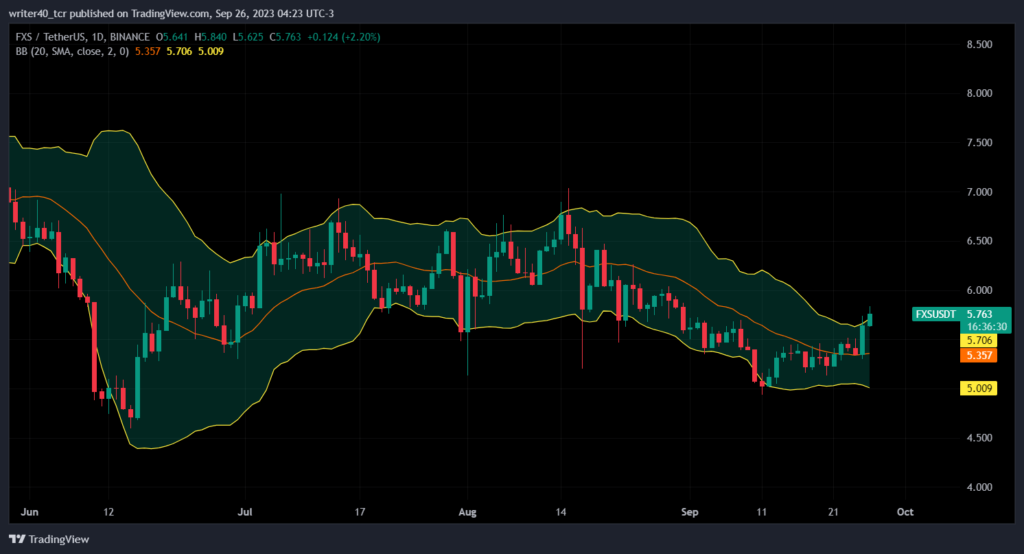
The FXS coin is trying to break the upper band of the Bollinger band indicator. It can witness some selling pressure here as a lot of sellers are usually present near the upper band. If the price sustains above the upper band, it will indicate that the buyers are in control of the price. The lower band of the Indicator is present at the $5.009 level, which can act as a support level for the price.
Conclusion
If the price sustains above the upper band of the Bollinger Band indicator, it can try to challenge the level of $7. Suppose it witnesses some selling from this level, it can come back again to the lower band of the Bollinger Band Indicator which is present near the level of $5. The band of the indicator is squeeze, which indicates that the coin is less volatile. In the upcoming days, the coin can witness some giant move on either side.
Technical Levels
Resistance – $7 and $10.804
Support – $4.560 and $4.018
Disclaimer
The views and opinions stated by the author, or any people named in this article, are for informational purposes only. They do not establish financial, investment, or other advice. Investing in or trading crypto assets comes with a risk of financial loss.



