
 Quack AI
 Pudgy Penguins
 Injective
 Solana
 NEAR Protocol
 Canton
 Zcash
Zcash
- Hilton Worldwide Holdings Inc. has given a return of over 23% annually.
- Hilton Worldwide Holdings Inc. has a dividend yield of 0.41%
The Hilton Worldwide Holdings Inc. (NYSE: HLT) is a company that operates in the hospitality industry. Its business involves the management, franchising, ownership, and leasing of hotels and resorts. The company operates through two main segments, namely Management and Franchise, and Ownership.
The stock of HLT has been moving with an uptrend momentum, and has been forming a pattern of higher highs.
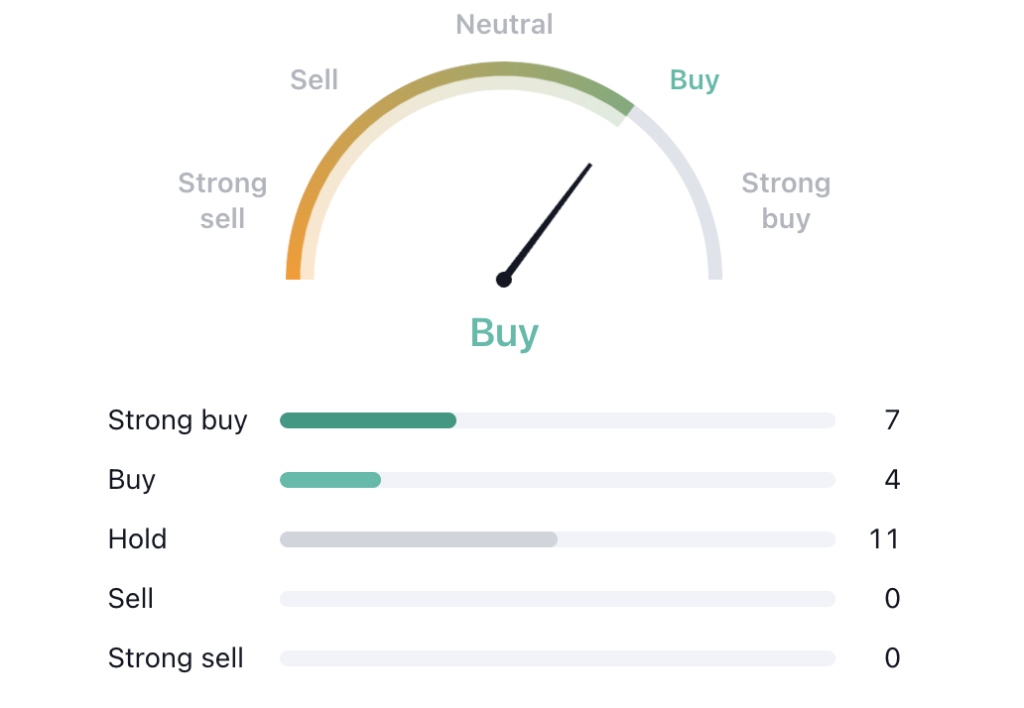
Over the past three months, analyst ratings for HLT stock have consistently provided buy signals, with seven analysts indicating a strong buy and none giving a sell signal. This collective sentiment indicates the stock’s potential for upward movement.
The company’s financial statements reveal an improving profit margin percentage and a growing revenue trend. In 2020, the profit margin was at -16.48%, but it saw a significant improvement to 7.03% in 2021, and it further increased to 14% in 2022. This substantial enhancement underscores the company’s strengthening financial position, making it an attractive prospect for potential buyers.
Hilton Worldwide Holdings stock reached its peak at $167.99 in April 2022, but subsequently experienced a notable decline of nearly 35% by the end of June 2022. Fortunately, it found support at the $108 level, and since then, the stock has demonstrated an impressive recovery, surging by over 42%.
At present, HLT stock is trading within the confines of an ascending triangle pattern, which is generally viewed as a positive sign. If the price manages to break above the resistance level at $156, it is likely to experience an upward movement in the coming days.
Hilton Worldwide Holdings Inc. (HLT) Technical Analysis
HLT by writer50_tcr on TradingView.com
Technical Indicators’ Overview
HLT stock is trading above the 50-day and 100-day EMA levels, which is generally seen as a positive signal. This increases the probability of the stock price increasing in the upcoming days,
Regarding the MACD indicator, the MACD line is positioned above the signal line. This alignment of the MACD line above the signal line is considered a positive indicator, suggesting that the price will likely increase in the days ahead.
Furthermore, the RSI line for HLT is trending upward, having previously entered the overbought region. With the RSI currently at a level of 65, it indicates the possibility of upward momentum, and is generally viewed as a positive signal for the stock price.
Conclusion
In summary, the trading performance of Hilton Worldwide Holdings Inc. (HLT) reflects a positive momentum. The stock has demonstrated strong performance in recent years, with increased earnings. Additionally, the indicators provide favorable signals. There is a likelihood of the HLT price rising in the days ahead.
Technical Levels
· Support Level: $7.58
· Resistance Level: $8.85
Disclaimer
The views and opinions of the author, or anyone named in this article, are for informational purposes only. They do not offer financial, investment, or other advice. Investing or trading crypto assets involves the risk of financial loss.




