
 IGNITION
 streamoors
 Injective
 NEAR Protocol
 Pearl
Pearl LayerZero
 Quantus
- The ZEN token is currently following a bullish trendline.
- The stock is currently trading at $7.5 with a growth of 2.3% in the last 24 hours.
- This token is down by 95.52% from its all-time high.
The token is currently trading with a decline of 36.5% in the trading volume in the last 24 hours.
The token marked its all-time high on 8th May 2021 when a single ZEN token was priced at $168.15. This token’s present market capitalization is $106.85M.
It has a current circulating supply of 14.16M ZEN, which is 67.43% of its total supply.
The 24-hour trading volume of the token is $4.50M.
ZEN Token Sentiment Analysis
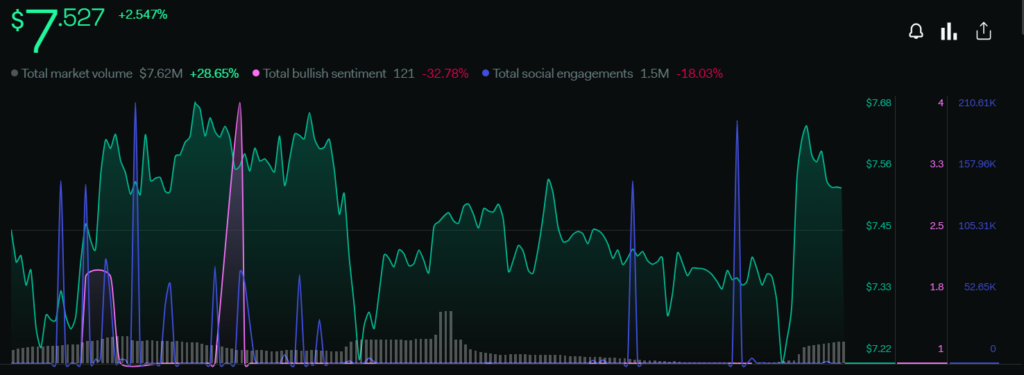
The price of the token has increased by 2.54% in the last 1 week and the total market volume of the token has surged by 28.65%. The total bullish sentiments declined by 32.78% and the total social engagements decreased by 18.03%, which shows a negative sentiment in the social community. The overall sentiments are neutral as the price and volume are rising but the sentiments of bullishness and social community are negative.
Technical Analysis (Daily)
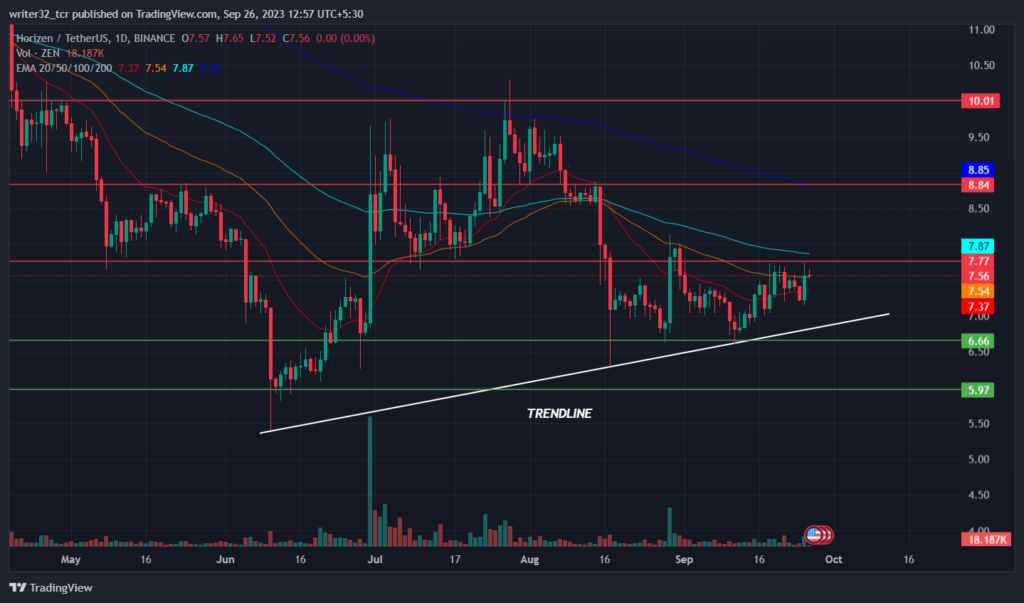
Horizen (ZEN) is currently following a bullish trendline. The token marked its year high of $15.7 on 15th Feb 2023 from where the price started a downtrend. The price fell to the level of $5.9 from where it took the support and started an upward movement. The token price touched the $10 range which is a resistance level. The ZEN coin price price got rejected again and reached the down level of $6.6.
ZEN token’s price is currently trading at the 50-day EMA and it is above the 20-day EMA. The price is below the 100-day EMA and 200-day EMA, which shows that the price is currently not so bullish.
ZEN coin’s price is currently trading near the $7.7 resistance from where it is getting rejected as the wick touched the resistance and came down. However, the volume is still increasing and if it keeps increasing, we will be able to break the resistance of $7.7 and get more upside moment. The target can be $8.8 and once it gets above the 200-day EMA, $10 will be the easy target to achieve.
Relative Strength Index (RSI)
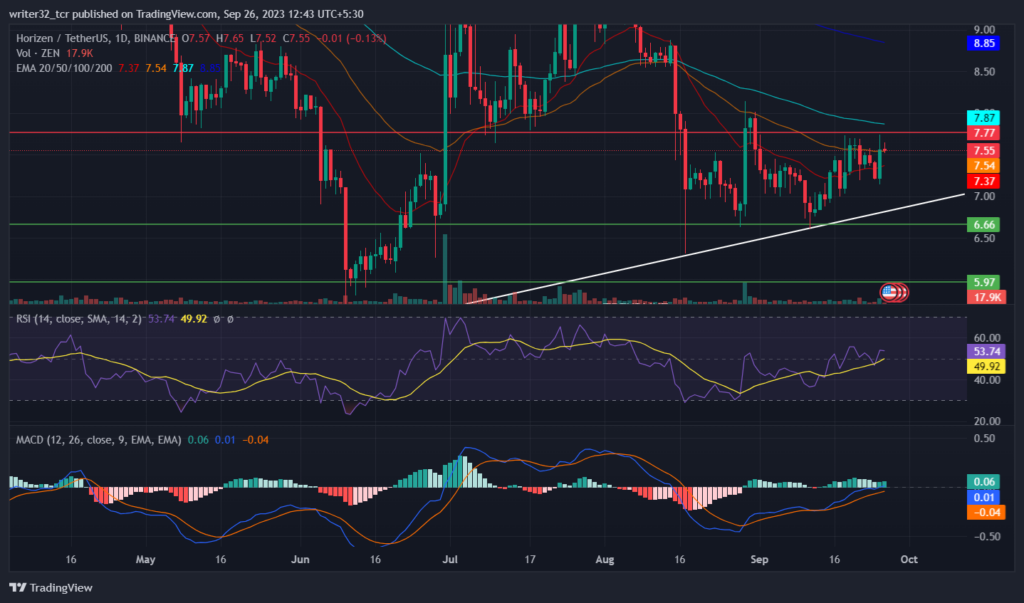
The RSI line is currently moving at 53.74 points and the SMA 14 line is moving at 49.92 points. The RSI is presently moving above the neutral level of 50. From there, if the RSI moves upward, the price will surely break the resistance of $7.7. Suppose the RSI falls, the price might get rejected from the resistance.
Moving Average Convergence/Divergence (MACD)
In MACD, The fast blue line moving average is moving above the red slow line moving average. The volume in the histogram is also showing a bit of increase, which indicates a bullish action in the price only if the volume keeps on increasing. If the volume in the histogram decreases, the price may start falling.
ZEN Coin Live Chart:
Conclusion
If the price gets rejected from the $7.7 range, the token value can again fall to the bottom of the trendline. The price is likely to take support from there. Suppose the trendline breaks, the next support will be at the $6.6 range.
Also, If the price breaks the resistance of $7.7 and gets above the 100-day EMA with a great amount of volume, the price can get more upside to $8.8 and $10.
Technical Levels
Support: $5.9 AND $6.6
Resistance: $7.7, $8.8 AND $10
Disclaimer
The views and opinions stated by the author, or any people named in this article, are for informational purposes only and do not establish financial, investment, or other advice. Investing in or trading crypto assets comes with a risk of financial loss.




