
 Dacity Coin
 Celestia
 Pudgy Penguins
 Injective
 Solana
 Sui
Sui Starknet
- The UNP stock price has been forming swing lows and lower highs since July 26, 2023, from the $240.48 level.
- The UNP stock price trades below the 20, 50, 100 and 200-day EMAs, reflecting bears’ dominance over the price.
Union Pacific Corporation (NYSE: UNP) is one of America’s most recognized companies and was founded in Utah in 1969. It is a publicly traded railroad holding company that offers transportation services for various industries.
Union Pacific Corp. (NYSE: UNP): Technical Analysis
The UNP stock price is currently trading at $202.40, with a decline of 1.19% during the intraday trading session. The stock has an average trading volume of 2,935,258 with the previous day’s closing price at $204.84. The UNP stock’s P/E ratio is 18.47 and it has a total market capitalization of $124,426,580,854.
Technical Analysis of UNP Stock
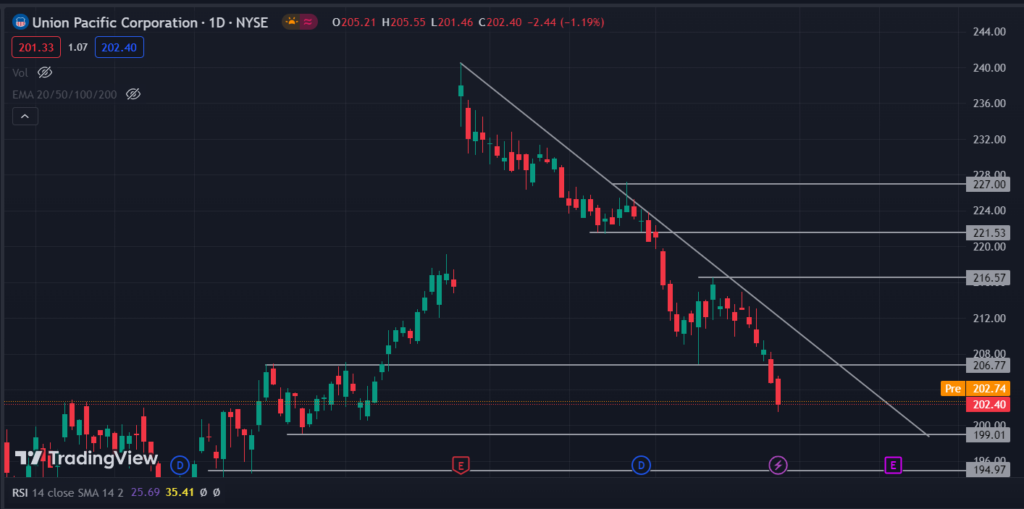
The stock price has been trading in a strong downtrend since July 26 2023 from $240.48 level. In this chart, the price is displaying a significant resistance to the trendline that’s forming above it. Additionally, it has broken down below the support level at $206.77, indicating a bearish momentum and the potential for further price declines.
The price is currently trading between the range of $206.77 and $199.01 after a fall of -6.92% because of the strong selling pressure. In the last two trading sessions, the price had formed a strong bearish candle at $206.77, reflecting the bears’ presence at that level.
If the UNP price gives a breakout of $206.77 then, the price may be seen rising to the trendline forming above. If it also breaks above the trendline, then it may reach its resistance level at $216.57. On the other hand, for the price to continue its downtrend, it should close below $199.01 after which it may fall to $194.97.
Technical Indicators on the UNP Chart
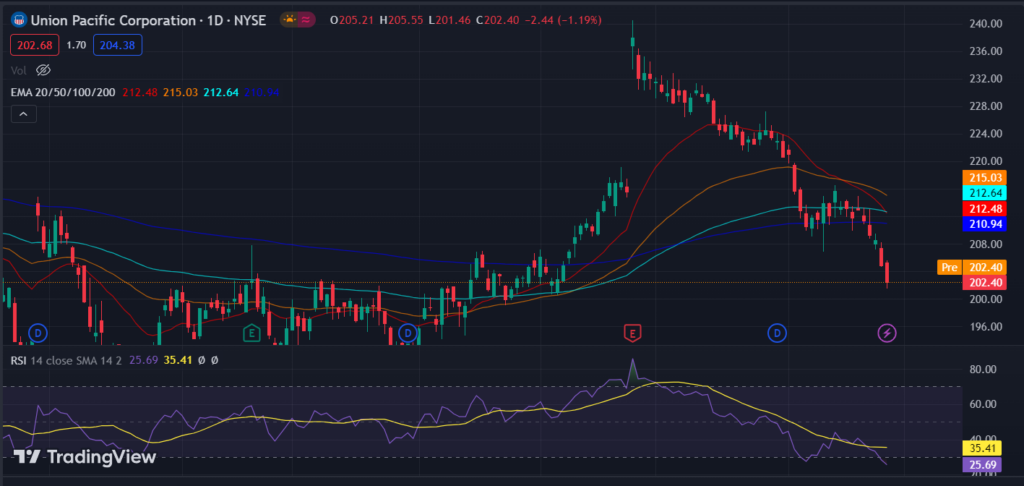
The UNP price is below the 20, 50, 100 and 200-day EMAs, indicating the bears’ dominance over the price in the current market phase.
The relative strength index (RSI) is currently trading at 25.69, which is below the 30 mark, indicating that the price is in the oversold territory. The RSI recently faced resistance from the signal line at 35.41, suggesting that the bears have control of the price at the moment. This could indicate a bearish trend or a potential reversal in the price.
Conclusion
The price structure in the chart is currently trading with a strong bearish momentum. It will continue to fall until it gets the required demand at the $194.97 level. If the UNP stock price gives a breakout of $206.77 then the price may be seen rising to the trendline forming above it. If it also breaks above the trendline then it may reach its resistance level at $216.57. On the other hand, for the price to continue its downtrend, it should close below $199.01 after which it may fall to $194.97.
Technical levels
- Resistance Levels: $206.77 and $216.57
- Support Levels: $199.01 and $190.68
Disclaimer
The views and opinions stated by the author, or any person named in this article, are for informational purposes only. They do not establish financial, investment or any other advice. Investing in or trading stock comes with the risk of financial loss.




