
 Quack AI
 NEAR Protocol
 Quant
Quant Quantus
 Pearl
Pearl Ondo
Ondo Bitway
- The Netflix stock price has surged by more than 65% in a year.
- The revenue of the company has been increasing over the years.
- It is trading below the 50-day and 100-day Exponential Moving Averages.
Market Capitalization of the Netflix Stock – $167.328 Billion
The Current Market Price of Netflix Stock – $377.59
Netflix Stock Overview
The Netflix stock in its previous trading session closed the day in the red with a decline of 1.66 or 0.44%. The stock has declined by over 4% in a week and 9% in a month, which indicates that sellers are taking control of the price. However, the stock price has surged by over 65% in a year, which indicates the bulls have dominated the price throughout the year.
The revenue of the company has risen from $8.83 Billion in 2016 and $31.62 billion in 2022. A rise of over 250% in 6 years, which is a massive growth for any company. If we examine the net income, it has surged marginally from $186.68 Million in 2016 to $4.49 Billion in 2022. A rise of over 2300% in just 6 years, which is remarkable for any company.
If we consider the net debt of the company, the company’s net debt has also increased significantly over the years. The net debt of the company in 2016 was just $1.66 Billion. It surged to $10.87 Billion in 2022. A rise of over 554% in 6 years, which is a matter of concern for the company. Netflix has not paid any dividends to its shareholders ever.
Technical Analysis of Netflix
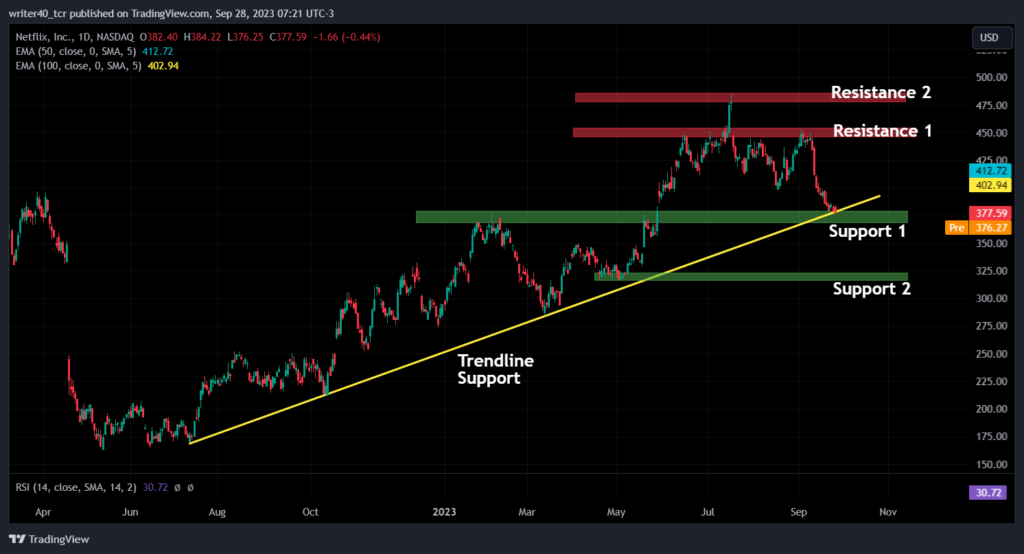
The NFLX stock price has faced a strong rejection from the $450 level, which is marked as Resistance 1 on the chart. Netflix stock has fallen sharply from this level and it seems the sellers are very aggressively shorting the stock from that level. This stock’s price is trading at the support level of $370, which was a resistance for the stock before. This level was broken by the stock in May 2023.
The stock is also trading with the support of the rising trendline, which can provide some extra push to the price in an upward direction. A crucial resistance level for the stock is present near the $485 level. It has been marked as Resistance 2 on the chart. Another support for the stock price is present near the $320 level, which is marked as support 2 on the chart.
The Stock Has Broken Important Exponential Moving Averages
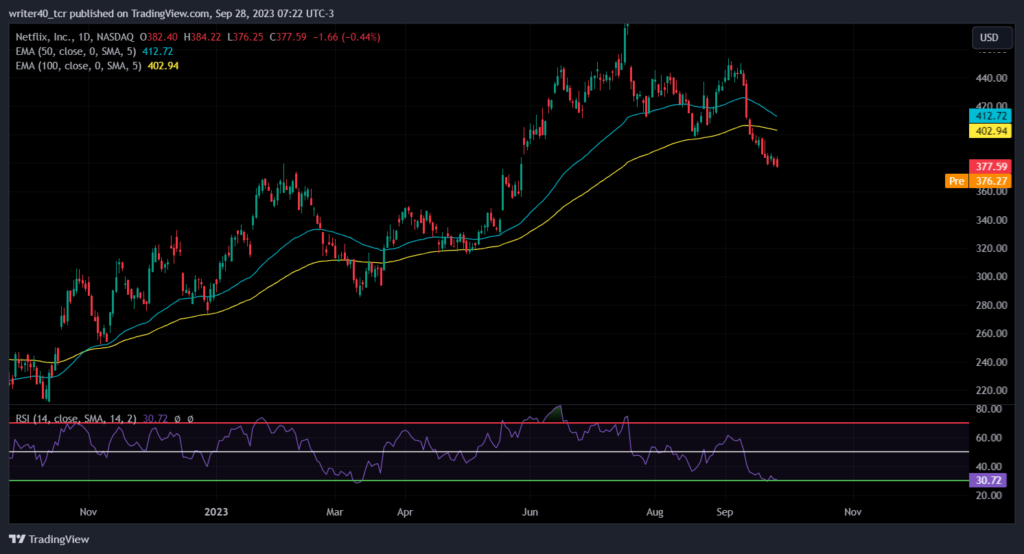
The stock price has started trading below the 50-day and 100-day Exponential Moving Averages, which indicates that the price is turning bearish. It has yet not witnessed an EMA crossover on the daily chart, which can confirm the downtrend for this stock. If we observe the Relative Strength Index (RSI, it has almost entered the oversold trajectory.
Conclusion
The stock price is trading very close to the horizontal support and trendline support zone and the RSI is near to oversold trajectory. It shows the NFLX price can show some bounce from this level. The price can face rejection near the $450 level and the support level is present at $370.
Technical Level
Resistance – $450 and $485
Support – $370 and $320
Disclaimer
The views and opinions stated by the author, or any people named in this article, are for informational purposes only. They do not establish financial, investment, or other advice. Investing in or trading crypto assets comes with a risk of financial loss.




