
 Dacity Coin
 Celestia
 Quantus
 Bitcoin
 Pearl
Pearl Pons
Pons Injective
- Decentraland’s native crypto asset “MANA” has been in a bearish trend for a long period of time.
- This token is currently trading at $0.30 with an intraday rise of 1.82%.
- The token is down from its all-time high by 94.9%.
MANA has recorded losses of 49.46% in the last 6 months and 21.71% in the last 3 months. The token marked its yearly high of $0.84, from where the price started falling and started a bearish movement.
After that, the price took price support from the $0.30 support and tried to gain the upside movement, but got rejected from the resistance level of $0.44. This time the MANA price fell further to the level of $0.28.
It is presently trading in a sideways movement with very small movements in the price levels.
The token is trading with a drop in the trading volume by 49.11% in the last 24 hours.
The current circulating supply of the token is 1.89B MANA, which is 86.31% of its total supply. It has a present market capitalization of $570.36M. The 24-hour trading volume of the token is $32.06M.
Sentiment Analysis
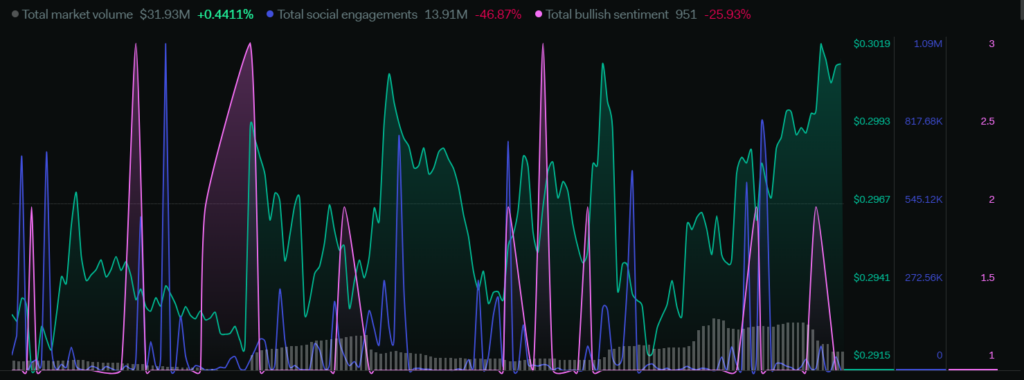
The total market volume has just increased by a bit of 0.44% in the last 1 week. The total social engagements dropped by 46.87% and the total bullish sentiments declined by 25.93%. The overall sentiments show that the community and the investors of the token are not actively engaging and investing because of this the volume has dropped. The bullish sentiments have declined, which creates a negative sentiment in the market. The present sentiments indicate a bearish move in the price.
Technical Analysis (Daily- 1D)
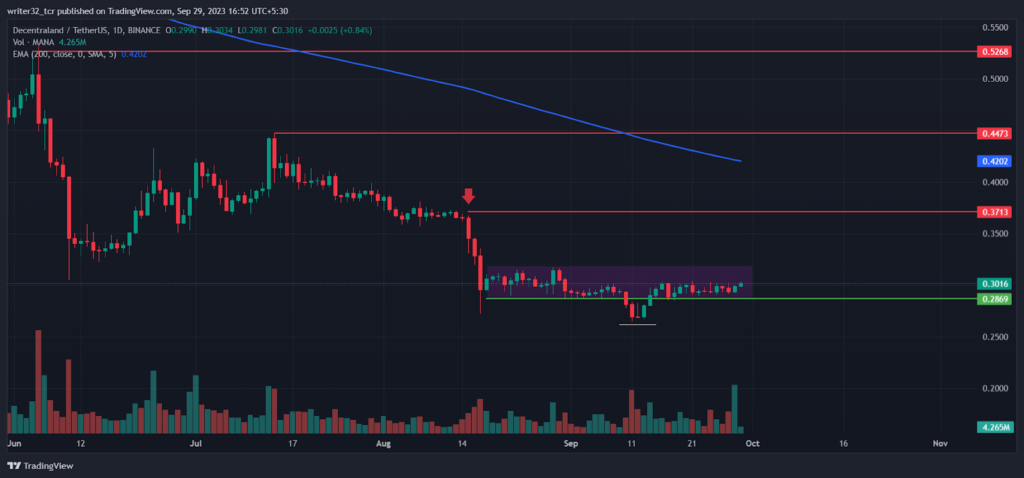
As we can see, the price is currently moving in a sideways movement not giving any major movement.
The price has to break the sideways movement for any major move in the price. To break the sideways movement, Firstly the price has to get above the range of $0.32. If the price breaks the sideways move below the support level then the price might fall further and continue its downfall.
The price will be bullish after it breaks the resistance level of $0.37 and gets above the 200-day EMA with an increased volume.
Relative Strength Index (RSI)
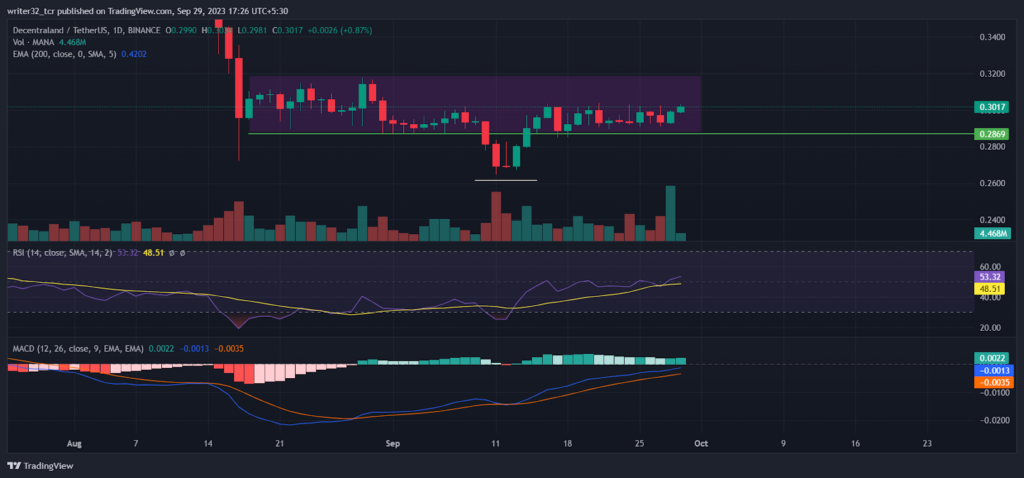
The RSI line is presently moving at 53.32 points and the SMA 14 is moving at 48.51 points. It is currently above the neutral level. If the RSI gets above 60 points, it will indicate a good buying activity in the market of the token. The price can be bullish after that. If the RSI falls below the neutral level, the price might fall again.
Moving Average Convergence/Divergence (MACD)
The fast blue line moving average is above the red slow line moving average. The volume of the histogram is showing falls in the volumes, which is not a good sign for the price. It should keep on increasing if the price has to move upside in a bullish movement.
Conclusion
The price of MANA has to break its sideways movement and approach the resistance level of $0.37. It has to break it with a good volume for an upward movement. Suppose the volume stays the same then the price might continue its sideways or even fall if the volume decreases.
MANA LIVE CHART :
Technical Levels
Support: $0.28 and $0.27
Resistance: $0.37, $0.44 and $0.52
Disclaimer
The views and opinions stated by the author, or any people named in this article, are for informational purposes only and do not establish financial, investment, or other advice. Investing in or trading crypto assets comes with a risk of financial loss.




