
 Dacity Coin
 Injective
 Starknet
 NEAR Protocol
 Pearl
Pearl Quantus
 Pump.fun
- Unity Software Inc.’s technical summary reveals a sell signal.
- Unity Software Inc.’s RSI has formed a negative crossover along with the EMA.
- U stock price has shown a falling return YoY.
The U stock is trading at $30.19, with a share float of 232 Million shares. The stock has an average volume of $9.5 Million, and the price is presently the EBITDA of the company is negative figures at around -$80 Million, which is declined by -44% YoY.
The stock price of Unity Software Inc. (NYSE: U) is currently exhibiting a downward trend, with the price consolidating within a specific range.
In November 2021, the stock reached a high of $210 before beginning a significant decline, ultimately dropping by nearly 88% and finding support at the $24 level. Recently, the price has shown signs of a reversal from its all-time low of $23.45 and is currently trading within a range.
The overall structure of Unity Software (U) appears to be displaying a weak pattern with a negative outlook. This suggests the likelihood of a price decrease in the coming days.
The technical indicator summary indicates weakness in the stock price, with 14 out of 26 indicators providing sell signals, while only 3 suggest a buy signal. Additionally, the moving averages summary strongly favours a sell signal for the stock price, increasing the probability of a price decline in the near future.
Furthermore, the company carries a debt of -$2.8 billion, and its free cash flow is currently at -116 billion, indicating negative cash flows and financial losses, which could negatively impact the company’s reputation.
Unity Software Inc. (U) Stock Price Analysis
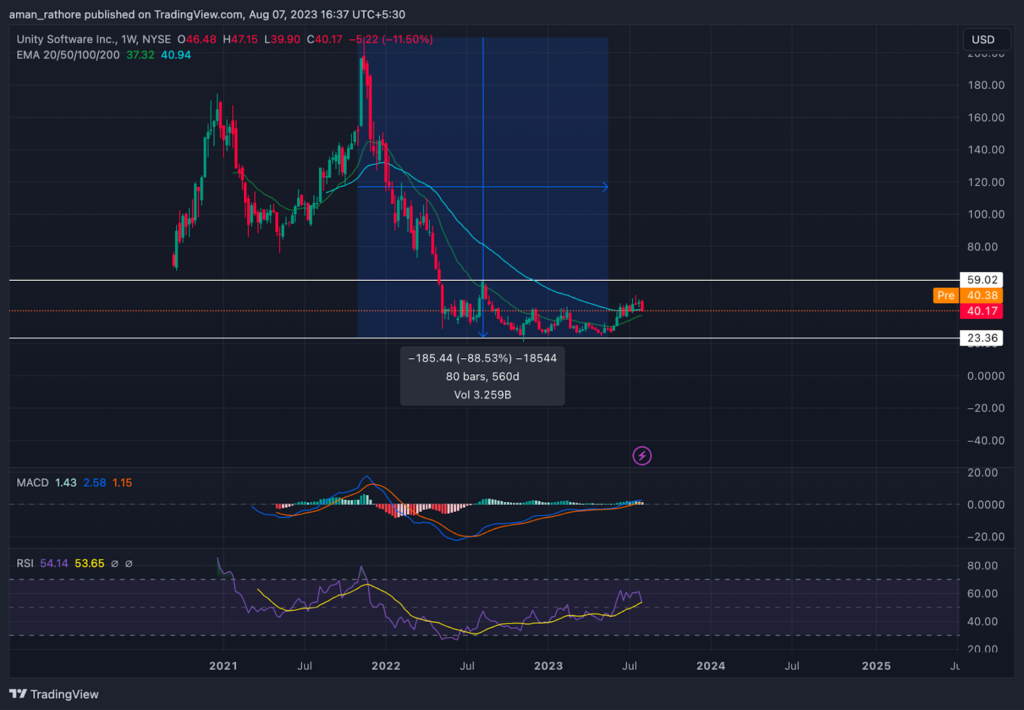
The current market price of U is situated below both the 50-day and 100-day EMA levels, indicating a bearish sentiment and the potential for a price decline in the coming days.
Furthermore, when examining Unity Software Inc.’s MACD indicator on a weekly basis, it’s evident that the MACD line is positioned below the signal line, signaling a bearish momentum. The presence of a negative crossover and a red histogram further support the expectation of a price decline for Unity Software Inc. in the near future.
Additionally, the data reveals a consistent decrease in trading volume for Unity Software Inc.’s stock, which is a concerning sign. This decreasing volume indicates a decline in trading activity and a reduced level of investor interest in Unity Software Inc. shares.
Conclusion
The analysis shows that Unity Software Inc. has formed a weka structure. The price is moving in a downward direction with the formation of lower lows in the candles. The stock price has given a negative return over the year and the indicators are also weak for the stock price. This increases the chance for the price fall in the upcoming days.
Technical Levels:
- Support – $24.
- Resistance – $39.
Disclaimer
The views and opinions of the author, or anyone named in this article, are for informational purposes only. They do not offer financial, investment, or other advice. Investing or trading crypto assets involves the risk of financial loss.




