
 streamoors
 Altai the Tiger
 Sword Inu
 IGNITION
 no crying in the casino
 Quantus
 Pearl
Pearl
- Ethereum coin witnessed a death crossover in the previous month.
- It has become “More centralized” with recent stacking growth said JP Morgan.
- The Ethereum coin price has jumped by over 20% in a year.
The current market price of Ethereum – $1630.6
The Ethereum Coin’s price after making a high of $4868 in November 2021, started its downward journey. It has melted down by over 81%. This kind of fall in the major crypto led the market into a selling mode. The Ethereum coin price reached a low of $881.56 in June 2022. It has been consolidating in a flat range since then.
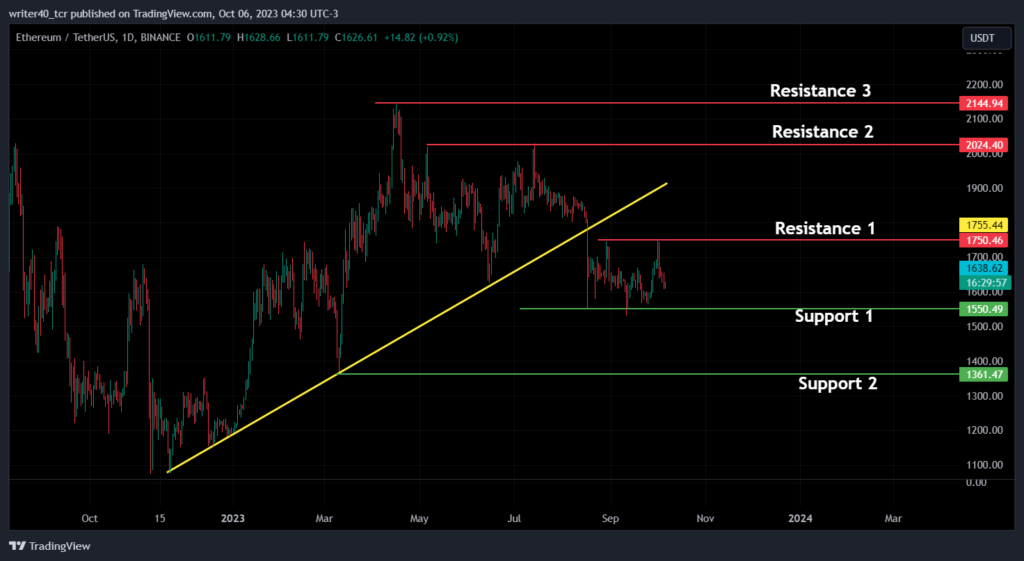
The Ethereum coin price has a dominance of 18.45% on the overall crypto market. It is the second most valuable crypto asset in the market after Bitcoin. The coin seems like making an inverted Flag and Pole pattern on the daily chart, which is a bearish pattern. The coin has been consolidating in a tight range of $1750 and $1550.
Overlook of the Ethereum Daily Chart
The ETH coin price has recently broken the rising trendline, which is a bearish sign for the coin. Its price has been consolidating in a range after the breakdown of the trendline, which can create some confusion in the sellers’ minds. ETH coin’s price is facing hard resistance at the $1750 level. It is the level where the price shown a breakdown on the chart.
The ETH coin price created a fresh demand zone at the level of $1550. The price has been tested thrice till now. Other major resistances for the coin are present at the level of $2024 and $2144. The support level for the price is present at the $1361 level. It is a very important support level as the trendline of the Inverted Flag and Pole pattern is present here.
Some Glimpse of the EMA and RSI indicators
Exponential Moving Averages
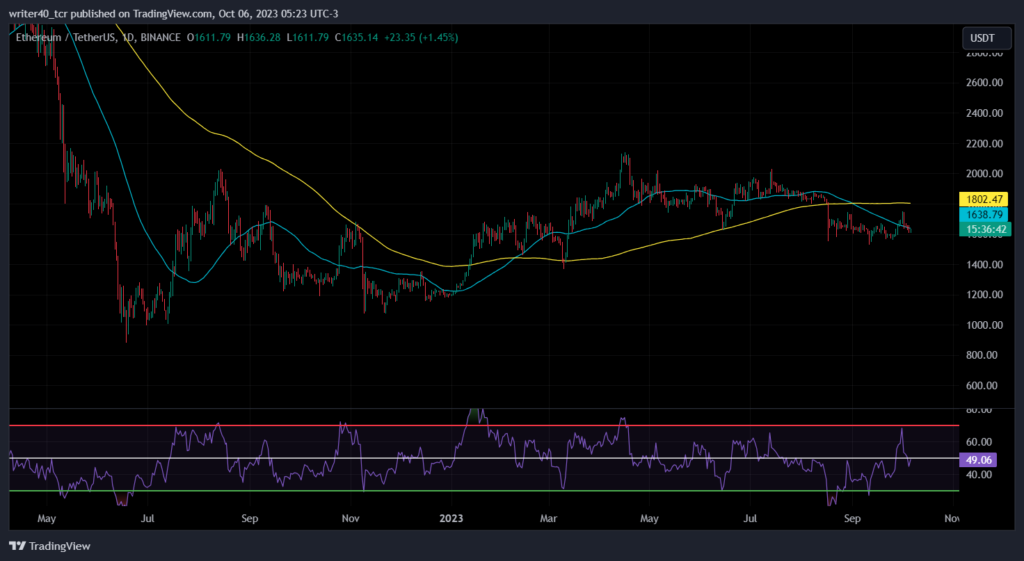
The Ethereum coin’s price witnessed a death crossover in the previous month, which is a bearish signal for the coin. The 200-day EMA is flat but the 50-day EMA is sloping downward. That indicates the selling is strong. Both the EMAs i.e. 50-day and 200-day are present at $1638 and $1802 respectively.
Relative Strength Index
The Relative strength index is currently placed below the 50 level which is not a good sign for the bulls. If we observe the slope of the RSI, it is downward and indicates that the momentum is favoring the bears.
Conclusion
Ethereum coin has breached the important trendline support, which indicates that the price is under the control of the sellers. Its RSI indicator also indicates the same thing. If the price breaks the support level of $1550, it will try to attain the $1361 level. Suppose the price breaks the resistance level of $1750, it will try to attain the $2024 level.
Technical level
Resistance – $1750 and $2024
Support – $1550 and $1361
Disclaimer
The views and opinions stated by the author, or any people named in this article, are for informational purposes only. They do not establish financial, investment, or other advice. Investing in or trading crypto assets comes with a risk of financial loss.




