
 streamoors
 IGNITION
 NEAR Protocol
 Injective
 Pearl
Pearl LayerZero
 Quantus
- Opendoor stock price has surged by over 12% in the previous trading session.
- Opendoor company’s revenue has declined by over 39% and 52% (YOY) in the previous two quarters.
- UBS has rated the OPEN stock “Neutral” with a target price of $2.75.
The current market price of the Opendoor Technologies – $2.68
Opendoor technologies have surged by over 12% in the previous trading session. It indicates that the buyers have dominated the entire day. It seems like the stock price is forming a double-bottom kind of pattern on the daily chart. However, the stock price has shown a massive decline of 33% in a month and 18% in a year. That signifies the bears are in control of the price throughout the year.
If we consider the revenue of the firm, it has reported a declined revenue (YOY) in the previous three quarters. However, the firm has shown decent growth in revenue over the year. The revenue of Opendoor Technologies has increased from $4.47 Billion in 2019 to $15.57 Billion in 2022. Opendoor has reported a net loss in its previous 4 financial years. The loss is deepening in every quarter.
Overlook of the Chart
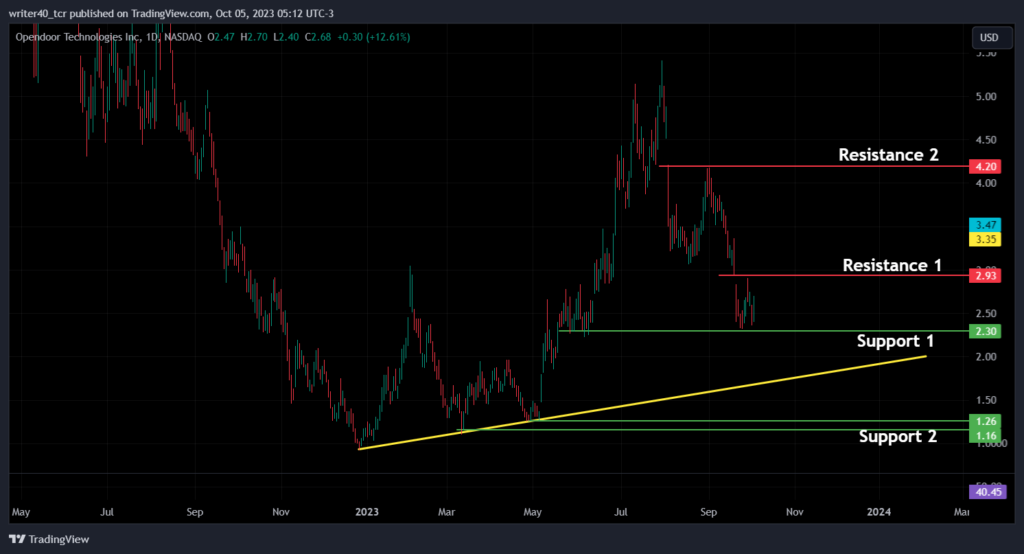
Opendoor stock price has formed a gap on the daily chart between the level of $4.50 and $4.20. If we notice, the price is facing a strong rejection near the gap area of the $4.20 level. The stock price has completed the W pattern and started declining. The stock price has declined to the current level. It is again forming a small W pattern on the daily chart.
Opendoor stock’s resistance level for the price is present near the level of $2.93. The current support for the price is present at the level of $2.30. The stock price has formed a rising trendline, which is marked as yellow on the chart. If we consider the other resistance and support levels for the price, they are present at $4.20 and $1.26 levels respectively.
Deep-dive into the indicators
Exponential Moving Averages
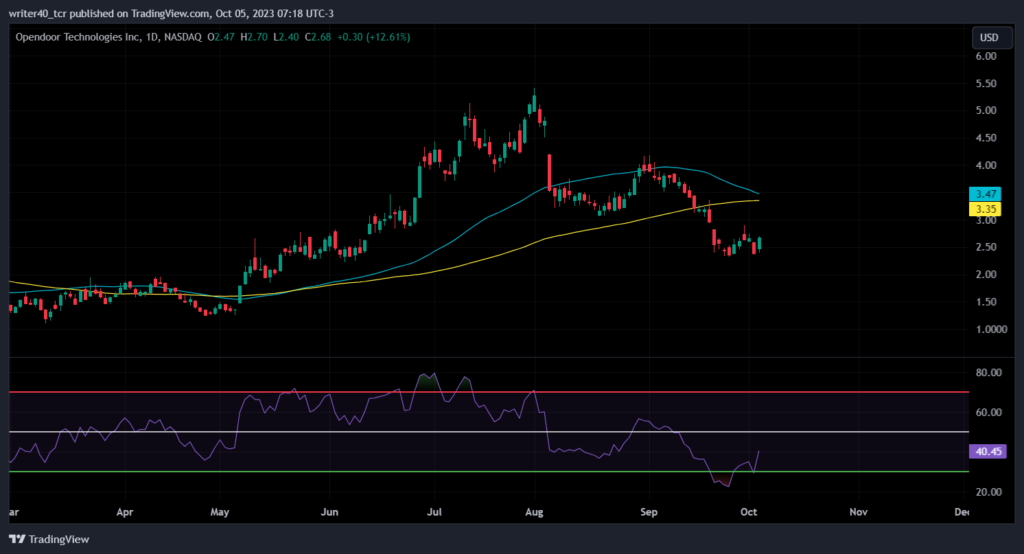
Opendoor stock’s price is trading below the 50-day and 100-day Exponential Moving Averages. The EMA is on the verge of showing a bearish crossover on the daily chart. Both EMAs will provide some liquidation to the price. They are present near the $3.47 and $3.35 levels.
Relative Strength Index
The Relative Strength Index has been in an oversold trajectory, this could be the reason for the current consolidation in the price. The RSI curve is now rising sharply and it is currently placed at the 40.45 level. It shows that the price is gaining momentum on the upside.
Conclusion
The RSI shows that the price is gaining some momentum for the uptrend. If Opendoor stock price breaks the resistance level of $2.93, it will try to complete the W pattern for the level of $4.20. Suppose the stock price breaks the support level of $2.30, it can try to achieve the $1.26 level.
Technical levels
Resistance – $2.93 and $4.20
Support – $2.30 and $1.26
Disclaimer
The views and opinions stated by the author, or any people named in this article, are for informational purposes only. They do not establish financial, investment, or other advice. Investing in or trading crypto assets comes with a risk of financial loss.



