
 Bitcoin
 Solana
 Pearl
Pearl Zerebro
 Aerodrome Finance
 LayerZero
 NEAR Protocol
- Rating firm Truist Securities raises the target price of the MA Stock from $450 to $475.
- The Mastercard Incorporated stock has breached the support level of $405.
- Mastercard’s net revenue and net income surged slightly by over 14% and 25% (YOY) respectively in the last quarter.
The current market price of the Mastercard Stock – $394.7
Mastercard Stock has breached the important support level of $405 and is sustaining below that level. It is currently trying to hold the previous swing low level. The stock price has ended the 3-day gaining streak in the previous trading session. The share price is surging in a rising channel.
Mastercard Incorporated stock’s price breached the level of $390 in the month of July 2023. It was a crucial resistance level to cross for the stock, as the price has been facing resistance since 2021. If we look at the broader picture, the stock has given an excellent return to its investors. The stock has surged by over 8600% since 2006.
MA stock has consolidated in a range of $280 and $390 for more than 2 years. The company is being supported by the good financial performance of the stock. However, the company has failed to reduce its debt over a period of time. This will eventually help the stock to resume its upward journey.
Outlook of the MA Stock Chart
The MA stock price currently holds a support level of $390, which was a very crucial resistance for the stock. If the price is unable to hold this level, then the stock can possibly form a head and shoulder pattern. The share price is supported by the trendline marked in yellow on the chart.
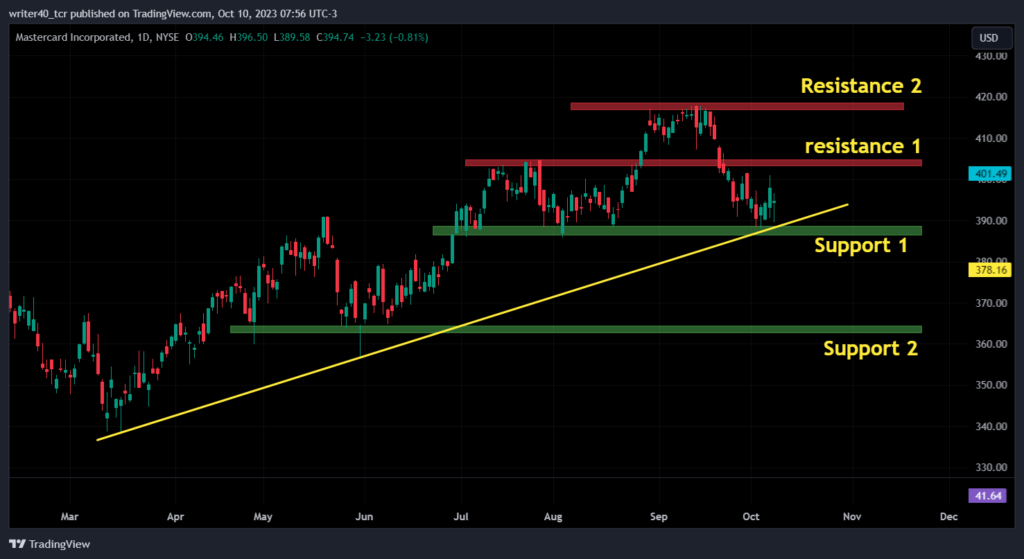
The MA stock price is again consolidating between the level of $390 and $405. The stock price was traded in this range between July and August of this year. Apart from this, $418 and $365 will act as resistance and support levels respectively. They are marked as resistance 2 and support 2 on the chart.
What Do the EMA and RSI Indicate?
Exponential Moving Averages
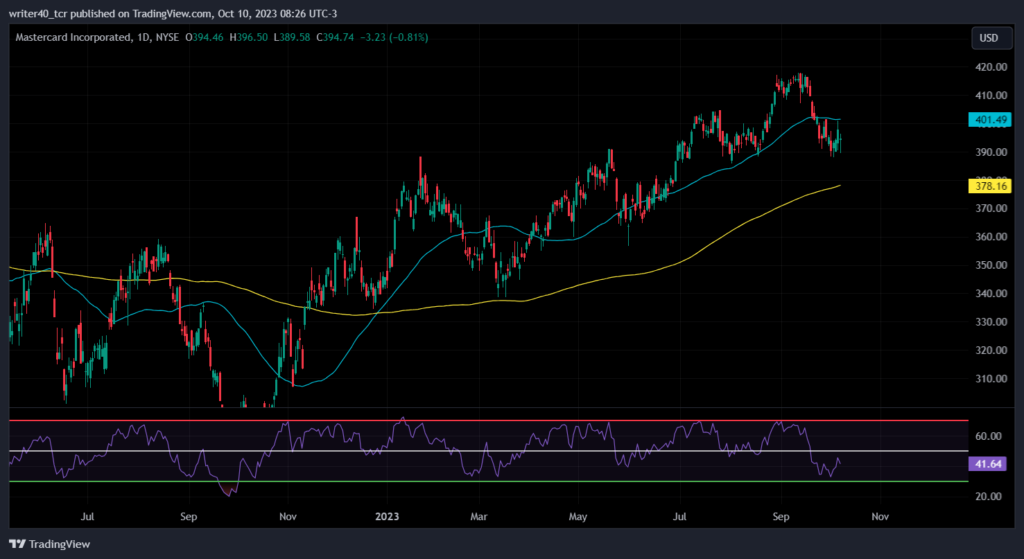
The MA stock price is currently trading below the 50-day Exponential Moving Average but above the 200-day Exponential Moving Average. It indicates that bears are trying to change the trend and control the price, but the overall trend is still bullish. This bullish trend was started after the stock witnessed a golden- crossover in Dec 2022.
Relative Strength Index
The relative strength index is currently sloping upward indicating the bulls are showing some strength. The RSI is still at 41.64 which signifies that the stock is still favouring the bears.
Conclusion
The MA stock has breached the support level and is currency respecting the trendline. If the price breaks this trendline support, the price can try to move towards the level of $365. If the price breaks the resistance level of $405, it can try to achieve the level of $418.
Technical Level
Resistance – $405 and $418
Support – $390 and $365
Disclaimer
The views and opinions stated by the author, or any people named in this article, are for informational purposes only. They do not establish financial, investment, or other advice. Investing in or trading crypto assets comes with a risk of financial loss.



