
 IGNITION
 streamoors
 Injective
 NEAR Protocol
 Starknet
 Quantus
 Bittensor
- 1INCH is giving a breakout from the bottom of the rising channel.
- It is currently trading at $0.237 with a repulse of 2.45% in the intraday sessions.
- The token is down by 96.98% from the all-time high.
The 1INCH token has recorded remarkable losses of 56.78% in the last 6 months and 26.95% in the last 3 months. The token’s price was trading in a rising channel and presently it is trying to give a breakout from the bottom of the channel.
It marked an all-time high on 9th May 2021 when the token was priced at $7.87. The token is currently trading with a drop of 40.60% in the daily trading volume.
The market capitalization of the 1INCH token is $245.47 Million. It has a circulating supply of 1.03 Billion 1INCH coins, which is 68.92% of the total supply. The 24-hour volume of the token is $13.70 Million.
Sentiment Analysis
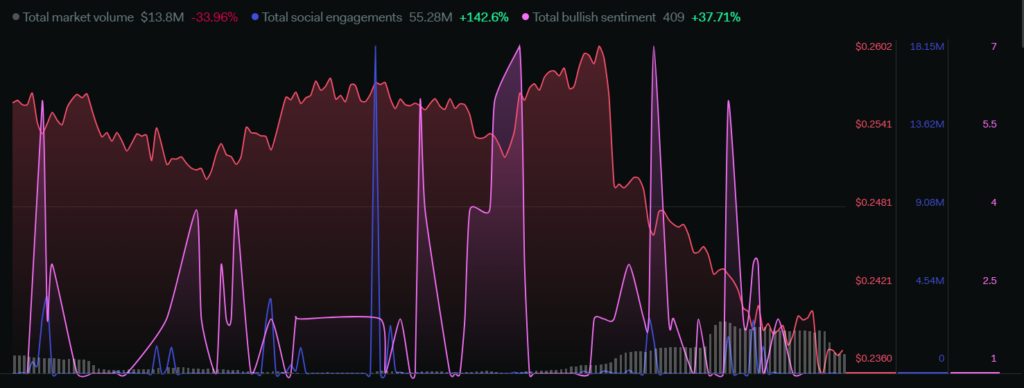
The total market volume of the token declined by 33.96% in the last week. Social engagements have increased by 142.6% and the total bullish sentiments have surged by 37.71%. Overall sentiments indicate bullish momentum but the volume is still falling. The volume has to increase for a bullish movement or else the price will fall further if the volume stays decreasing.
Technical Analysis Of 1INCH (Daily-1D)
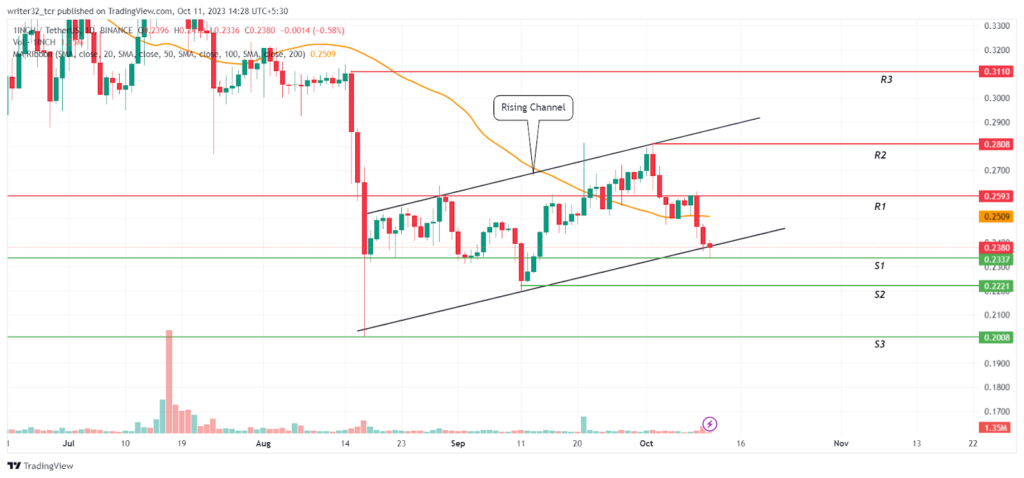
The 1INCH coin marked its yearly high of $0.6975 in February and since then the token has been in a downtrend. Presently, the price started falling from the level of $0.311 and the bears took the price down to $0.200. The price took support from the $0.200 level as it is a historic support and the bulls entered from there and took the price up. 1INCH coin’s price is moving in a rising channel now.
The price is currently giving a breakout from the bottom of the channel and the volume at the time of writing this article has dropped by 40%, which indicates a bearish sign. However, the price can still take support from $0.233 if the volume rises at the support level or else the price can start a bearish move. The next support levels will be $0.222 and $0.200.
The price is trading below the 50-day EMA, which is also a bearish sign.
What Do Indicators Say About the 1inch Coin?
Relative Strength Index (RSI)
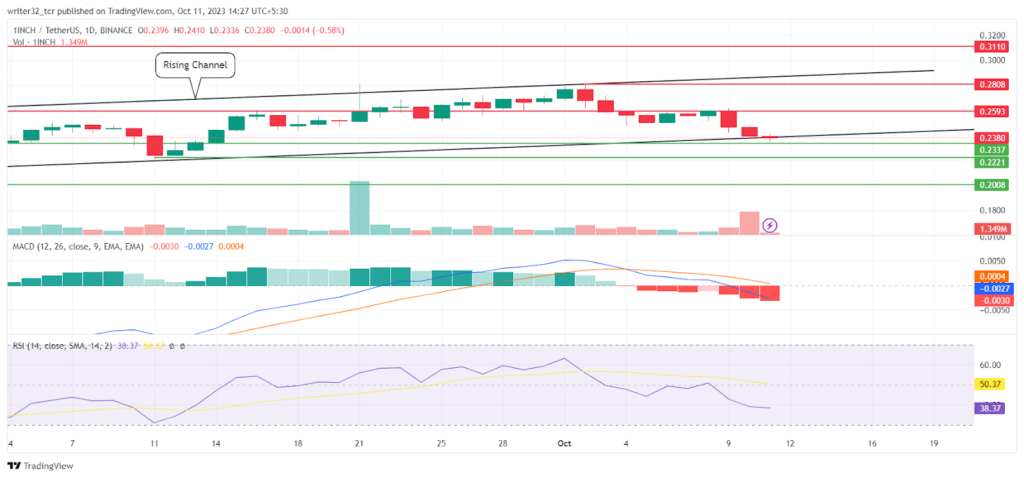
The RSI line is presently moving at 38.37 points and the SMA 14 is moving at 50.37 points. It is moving below the neutral level of 50. The RSI indicates a bearish movement as it will soon enter the oversold region. Token’s price can start a bullish move once it enters the oversold region as from there bulls will enter the market again.
Moving Average Convergence/Divergence (MACD)
The fast blue line moving average is moving below the red slow line moving average. The volumes in the histogram show big falls in the volume, which indicates a bearish move in the price.
1INCH LIVE CHART
Conclusion
The current scenario of 1INCH shows that the price can behave bearish as it is giving a breakout from the falling channel and the volume is also falling. However, if the price maintained its level above the bottom of the channel and the volume started to increase, the price would start an upward move. There are chances that the price can break the resistance of $0.280 in this move.
Technical Levels
Support: $0.233, $0.222 and $0.2000
Resistance: $0.259, $0.280 and $0.311
Disclaimer:
The views and opinions stated by the author, or any people named in this article, are for informational purposes only and do not establish financial, investment, or other advice. Investing in or trading crypto assets comes with a risk of financial loss.




