
 Covenant x402
 hi
hi Pearl
Pearl Quantus
 Pudgy Penguins
 Boomer
 Lighter
- Blackstone Inc (BX) is currently trading at $107.27. It has a market value of $127.455 billion US Dollars.
- Blackstone merges with the leading Insurance and Credit Business to form Blackstone Credit & Insurance (BXCI).
- During today’s trading, BX is up by 1.88%. Let’s use technical analysis and technical indicators to examine the BX Stock.
Blackstone Inc. was founded in 1985 by Stephen A. Schwarzman and Peter G. Peterson. It is an American AIM (Alternative Investment Management) company. It also provides credit, hedge funds, infrastructure, insurance, secondaries, & growth equity services.
Strong fundamentals in BlackStone Inc (BX) make it a desirable investment opportunity. The business had a Net Income of $1.75 billion in 2022, a decrease by $4.11 billion from the year before. The business made $13.62 billion in profits in 2022, an increase by $1.03 billion from the previous year. Additionally, its Operating Income was $3.70 billion in 2022, a decrease by $10.04 billion from the previous year.
The BX stock performance has seen substantial growth over time, with the stock increasing by 211% over the course of its entire history. Even over the last five years, the BX stock has experienced rapid growth, rising by 207%. It had a growth rate of almost 25.40% the year before. BX is in good financial shape, especially when it is compared to the previous year. As of June 2023, the assets under management were approximately $1 trillion US Dollars, making Blackstone the largest AIM firm globally.
Technical Analysis of the BX Stock
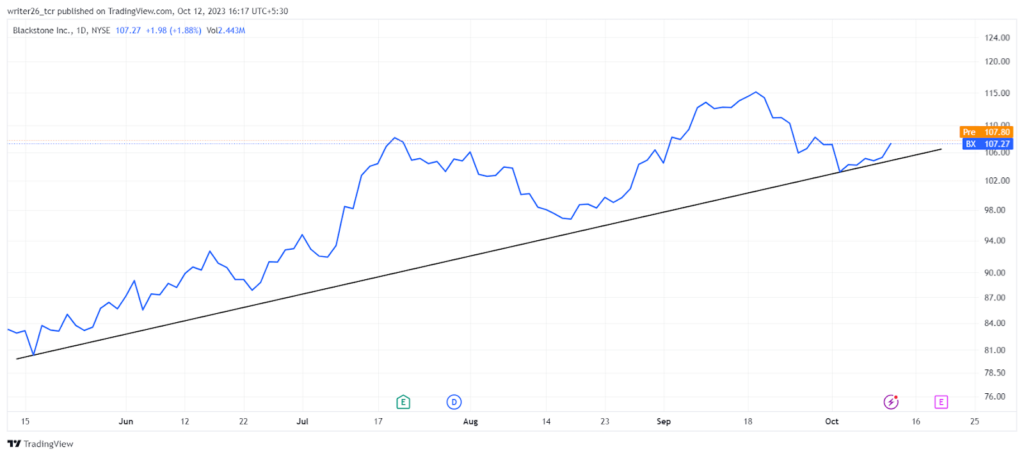
BX stock’s ATH (All-Time High) was made on 19 November 2021, which was $149. Since January 2023. The BX stock has been performing extremely well. The presence of bulls over bears can be seen through chart analysis. This stock took multiple support points from the trend line. Near the current market price, it might take some support for its continuation.
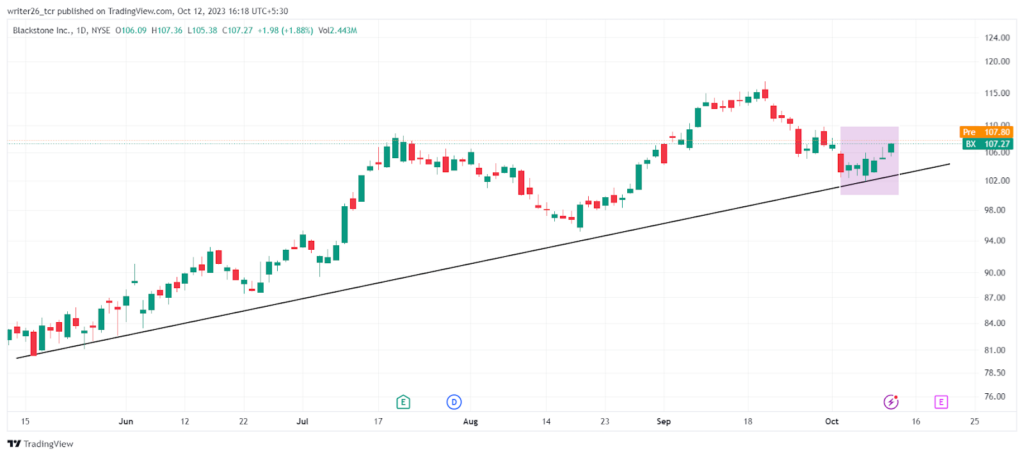
Near the current market price, the BX stock is forming a “Bullish pattern”. It means that the price will continue to rise in the future. The dominance of the Bulls will be seen in the upcoming trading days. The current market sentiments of BX stock are Bullish. This stock’s market price volatility is approximately 3.49% over the last 30 days.
The 5-D stock increased by 2.91%. The stock price decreased by 4.68% over the previous month. It has increased by 29.85% over the preceding six months of 2023.
SMA and EMA (50,100,200)
Simple Moving Average
The SMA 100- $99.60 (Buy)
The SMA 200- $93.02 (Buy)
Exponential Moving Average
The EMA 100- $101.11 (Buy)
The EMA 200- $97.45 (Buy)
Live Chart of BX
Conclusion
The BX stock seems to have solid fundamentals and could be a worthwhile purchase based on both technical and fundamental analysis. The financial performance of the stock was excellent. BX’s stock has consistently grown over the long term. It might continue its same momentum for some more time. The candlestick pattern predicts that the price will be in the favour of bulls.
Technical Levels
Support level- $80.50
Resistance level- $108.93
Disclaimer
This is a general article that does not provide any financial information. Investors should focus on both technical analysis as well as fundamental analysis. The analysis is done to provide information to readers. To make them aware of investments. All the data is fluctuating due to stock market hours. It might change when readers read the article.




