
 Boomer
 Pearl
Pearl Covenant x402
 Claudia
 Bitcoin
 hi
hi NEAR Protocol
- The Lyft Inc. Share price is reclaiming itself from lower levels.
- The LYFT stock is more volatile as it has a beta of 2.18.
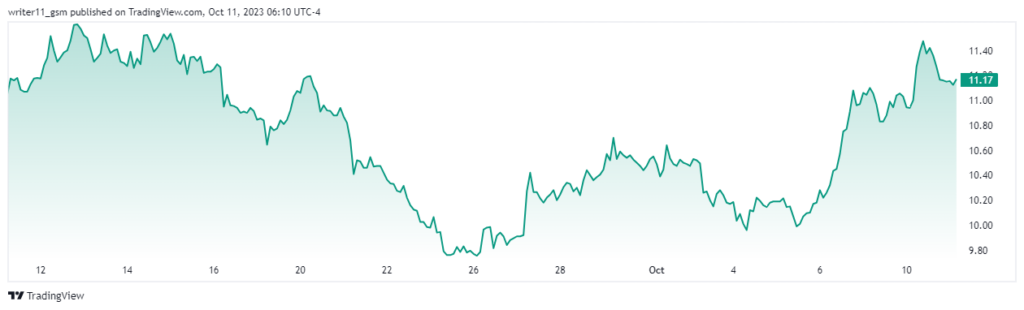
Lyft is an American company founded in 2012 by Logan Green and John Zimmer. It offers mobility as a service, vehicles for hire, rental cars, and food delivery. It operates in the US and certain cities of Canada. The company has its headquarters in California, U.S. The current CEO of the company is David Risher.
Lyft Inc. has 322.449M shares floating in the market and the current market cap of the stock is $4.318B. The LYFT stock also has a beta of 2.18, which generally indicates that the stock moves more than the overall market. The company has a negative EPS of -$3.57, which indicates that the company is facing a loss on each share.
The revenue of the LYFT stock is reported to be advanced by 3.0% in the second quarter of the year 2023. It has reported a revenue of $1.02B and a gross profit of $319.78M. The company has more than 4K employees. Despite this Lyft Inc. has witnessed a decline of 80.6% in the EBITDA of the company in Q2 2023.
Lyft Inc. Stock Performance Analysis
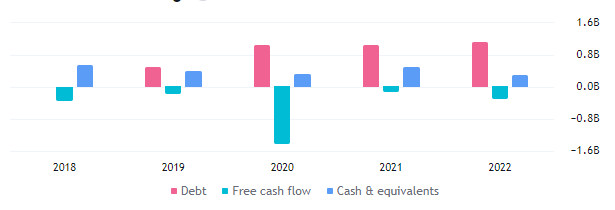
Lyft Inc. has made a revenue of $4.10B in the year ending 2022. Its net income has declined to -$1.58B, resulting in a negative profit margin of -38.69%. It further follows a debt of $1.10B in the year ending 2022. The company is also at a negative cash flow of -$308.50M and the cash and equivalents at the company are $282.45M.
Performance Analysis of LYFT Stock
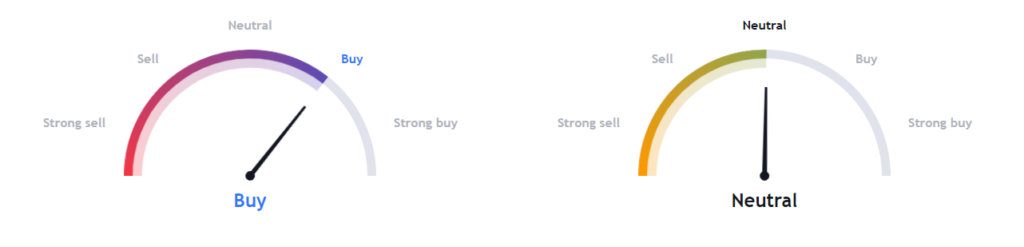
Following a recent advance in the LYFT stock price, the technical indicators for the stock have become bullish. The experts are still neutral on the stock as the company does not have any huge change in its financials.
LYFT Stock Showing Signs Of Buyers Presence, Will It Break Above The Pattern?
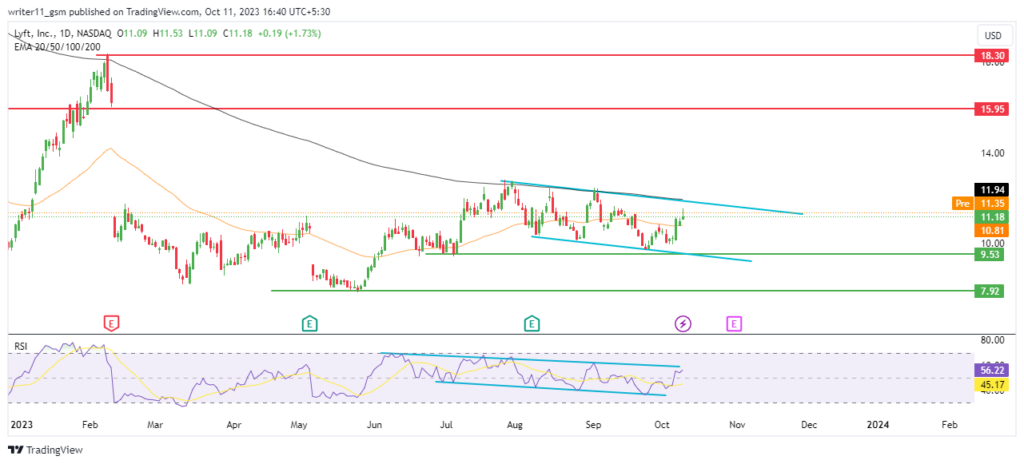
LYFT stock price is trading inside the falling wedge pattern. It also is forming a bullish candlestick pattern leading the stock price to higher levels. If the buying momentum in the stock continues, it can lead to a breakout above the wedge pattern.
The EMAs for the LYFT stock are trading in a downtrend following the Death Cross. The 50-day and the 200-day EMAs are trading close to each other and the stock price is trading inside the band.
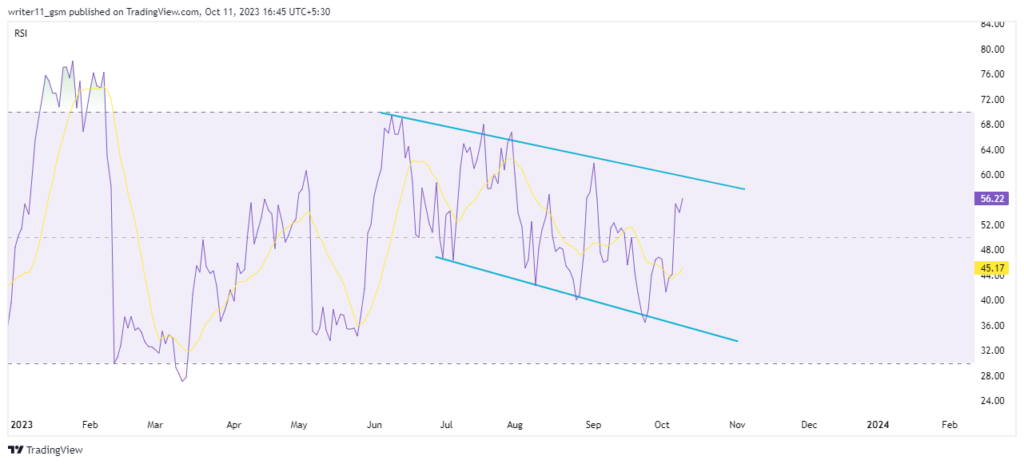
The RSI of the LYFT stock follows a similar pattern as the stock price. The RSI currently is trading inside the wedge pattern, following the bullish cycle.
Conclusion
Lyft Inc. has not shown any significant change in its financials while its stock has witnessed buying in recent times. If the LYFT share price breaks above the 200-day EMA with an advance above the wedge pattern in the stock price and the RSI. It can lead to a very good upward move in the stock. Otherwise, the share price may remain bearish to volatile.
Technical Levels
- Support levels- $7.90 and $9.50
- Resistance levels- $16.00 and $18.30
Disclaimer
The information provided in this article, including the views and opinions expressed by the author or any individuals mentioned, is intended for informational purposes only. It is important to note that the article does not provide financial or investment advice. Investing or trading in cryptocurrency assets carries inherent risks and can result in financial loss.




