
 Dacity Coin
 Injective
 NEAR Protocol
 Quantus
 Bitcoin
 Pearl
Pearl Sui
Sui
- The Render coin price has given a breakout of the symmetrical triangle pattern.
- It has surged by over 300% in a year.
- This token is struggling to cross the 200-day Exponential Moving Average.
The current market price of the RENDER Coin- $1.78
The Render coin in the current session is trading with a decline of $0.011 or 0.61%. It has recently crossed the important resistance level of $1.661. It has shown a positive price action after that, as the price has tested this resistance level. Now the coin price is showing some strength on the upside and trying to breach the recent swing it created after the breakout.
Render coin price was in an uptrend till May 2023, as it has surged by over 630% from the lower level. The coin price started the downtrend in May 2023, as the price has started making lower highs and lower lows. If we calculate the down-move, the price has corrected over 57% since May 2023. However, the coin after the correction has formed a base at the lower level.
The coin price has faced a rejection from the broken support level of $1.661. It showed some strength there and because of that the new buyers have taken the price above the resistance level. Right now, the coin price is trading close to the 300% gain in a year. If we consider the price action of 2023 only, the price is trading up by over 344% from the year’s low.
A short outlook of the RNDR coin Chart
The RNDR coin price gave an awesome breakout from the symmetrical triangle pattern it has formed on the daily chart. The coin price is supported by the rising trendline, which is currently present at the $1.382 level. The coin price broke the level with a Marubuzo candle, which is a well-known bullish candle. This candle has breached the trendline along with the resistance level which was a great bullish sign.
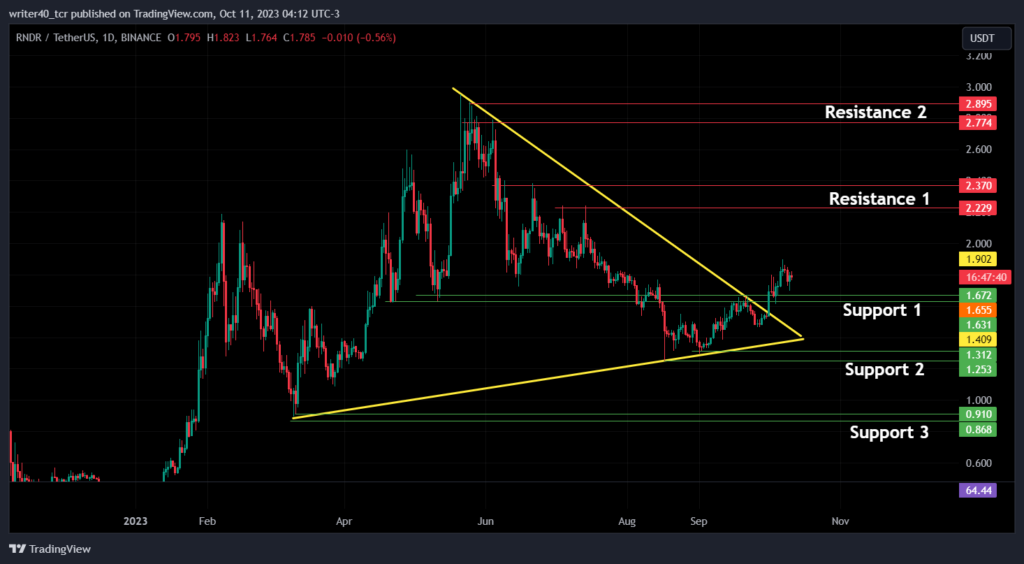
The RNDR coin price has created various support and resistance levels because of its past movement. If we consider the resistance levels for the price, they are present at $2.229 and $2.774 levels. The support levels for the coin are present at the level of $1.672, $1.312, and $0.910.
What indicators specify about the RNDR coin?
Exponential Moving Averages
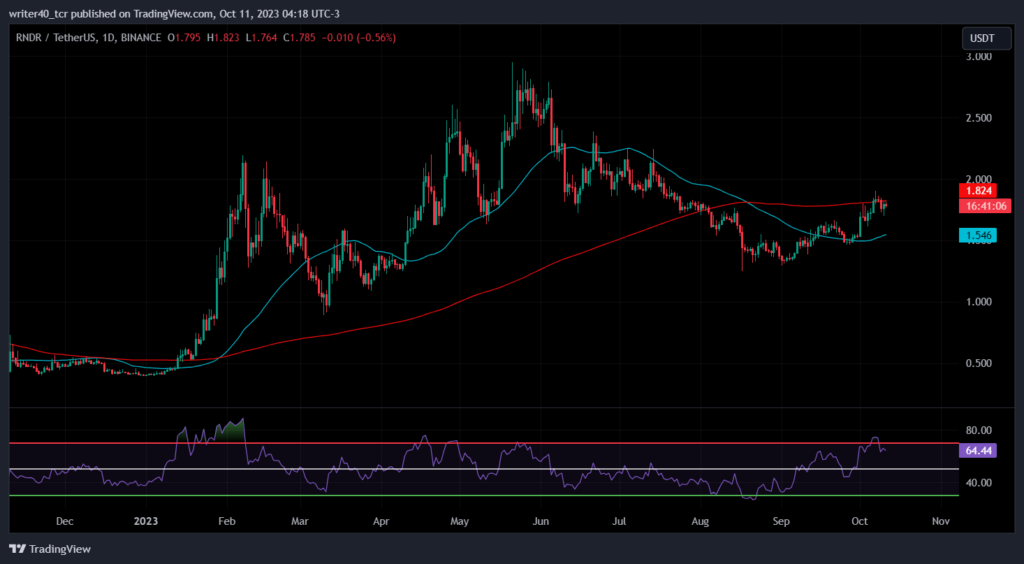
The coin price has retained the 50-day Exponential Moving Average but still struggling to cross the 200-day Exponential Moving Average. EMAs have shown a death crossover on the daily chart, but the coin price was unable to sustain the downtrend. The EMA is providing liquidity to the coin price.
Relative Strength Index
The Relative Strength Index is currently placed at 64.44 level, which is a good sign for the bulls. The coin was overbought according to the RSI, and it could be a reason for the halt on the uptrend.
Conclusion
The RNDR coin price has recently breached the resistance level of $1.661 and it is sustaining above that. The RSI is showing that the buyers are currently gaining momentum. If the price breaks the support level of $1.661, it can try to achieve the level of $1.312. Suppose the coin price sustains from here, it can try to move towards the level of $2.229.
Technical level
Resistance – $2.229 and $2.774
Support – $1.661 and $1.312
Disclaimer
The views and opinions stated by the author, or any people named in this article, are for informational purposes only. They do not establish financial, investment, or other advice. Investing in or trading crypto assets comes with a risk of financial loss.




