
 Boomer
 hi
hi Claudia
 Covenant x402
 Pearl
Pearl Quantus
 Bitcoin
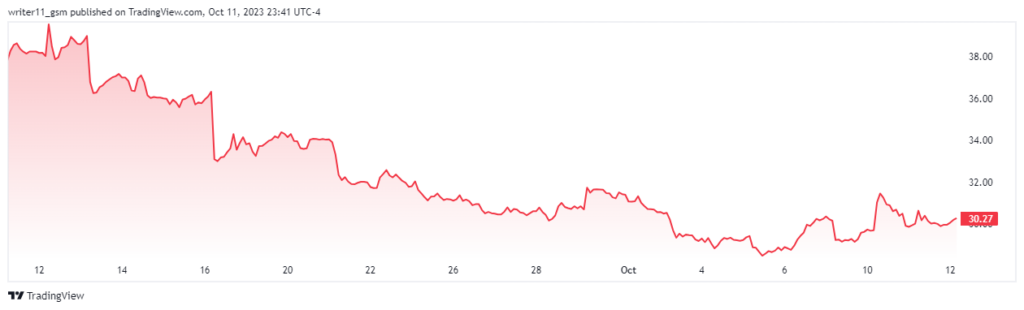
- The U Stock price has been consistently advancing for the last five days.
- It is facing selling pressure at the bottom levels.
Unity Software Inc. is a video game software developer based in San Fransisco. The current CEO of the company is John Salvatore Riccitiello and the company works in the technology services sector. As of 2022, the company has more than 7K employees working and the company was founded in the year 2004. Unity Software Inc. was founded in Denmark as Over the Edge Entertainment and changed its name in 2007.
Unity Software Inc. stock has 232.832M shares floating in the market and 39.28% of the shares of the company are closely held by investors and institutions. Out of the total number of shares, 60.72% shares are available for trading in the market. The stock has a negative EPS of -$2.84 and the average trading volume of the share is 10.74M.
The U stock has a beta of 3.71 is very volatile and risky compared to the overall market. It has a negative PE ratio of -11.29, which recommends a strong sell for the stock. Despite this, the stock has a very good debt/equity ratio of 86.26%. The company also has a very good price-to-book ratio of 3.34. U stock has a 52-week range of $21.22-$50.08.
Unity Software Inc. Stock Performance Analysis
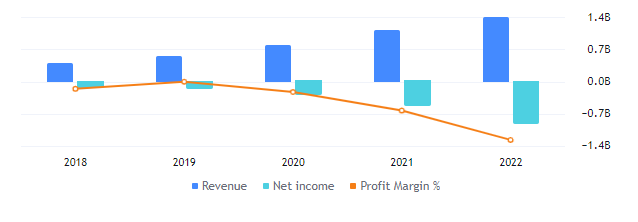
Unity Software Inc. reported a revenue of $1.39B in the year 2022, leading to a negative profit margin of -66.21%. The net income of Unity Software Inc. has also declined by 5.3% in Q2 2023, resulting in a decline of -44.9% in EBITDA year-on-year. Despite of increase in the revenue of the company, the expenses are also increasing. It has led to a massive decline in the company’s profits.
Performance Analysis of U Stock
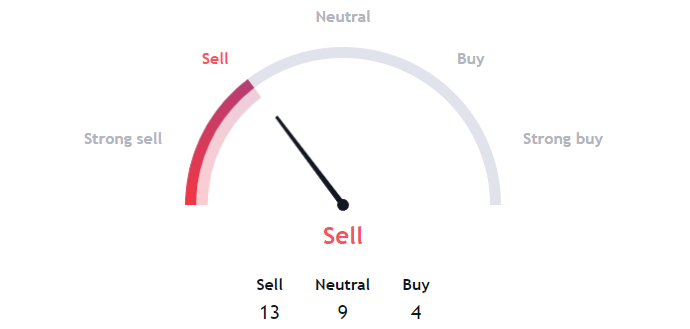
As the U stock price has declined to lower levels, the technicals for the stock on the daily timeframe are indicating a bearish signal. The majority of the moving averages are trading above the stock price while the oscillators are neutral. It sums up to a sell signal for the stock.
Will U Stock Price Reverse from the Current Levels or Continue to Decline?
a by writer11_gsm on TradingView.com
The share price of U stock is trading inside a huge range that can also be called a rising wedge pattern. In the most recent price action, the stock price is making lower low patterns, witnessing the dominance of sellers in the stock.
The 50-day and the 200-day EMA are trading in a death cross, indicating the presence of sellers. This is because the price of the share has declined by more than 10% below the EMAs. The following behavior of the market represents the bearish pressure in the U stock price.
The RSI for the U stock is already trading in bearish zones trading at a level of 38.83 in the last trading session. The 14-day SMA has also declined to 32.59. It indicates the bearish momentum in the stock.
Conclusion
Unity Software Inc. has faced huge losses in recent times. It is not witnessing any big change in the second quarter of 2023. The technicals for the U stock are also bearish, following the EMAs and RSI indicating a sell signal. The stock price is also following a bearish market structure by forming lower low patterns.
Therefore, if the U stock price breaks below the rising wedge pattern, we can witness a much greater decline in the share price in the upcoming days.
Technical Levels
- Support levels- $21.30 and $28.50
- Resistance levels- $39.50 and $48.50
Disclaimer
The information provided in this article, including the views and opinions expressed by the author or any individuals mentioned, is intended for informational purposes only. It is important to note that the article does not provide financial or investment advice. Investing or trading in cryptocurrency assets carries inherent risks and can result in financial loss.




