
 Quantus
 Pearl
Pearl Quack AI
 Starknet
 NEAR Protocol
 Zcash
Zcash Aerodrome Finance
- The CMCSA price is up $0.86 since its last intraday session.
- The price is currently retesting its crucial level.
Comcast Corporation (NASDAQ: CMCSA) is the largest American telecommunication and media company. It provides services like video streaming, internet facility, and phone call service.
Comcast Corporation (CMCSA) Stock Analysis
Comcast’s stock price was up by $0.86 in its last intraday sessions and it is now trading at $44.47. The market capitalization of CMCSA stock is $183.445 Billion and it trades with an average 10-day trading volume of 17.198 Million.
Comcast Corporation (CMCSA) 1-Day Chart Analysis
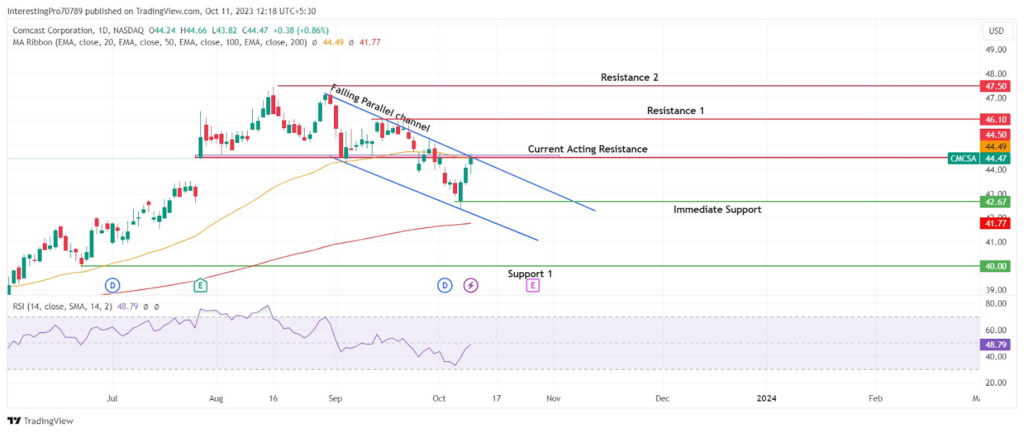
In the wider outlook of the CMCSA stock’s 1-day chart, its price seems to be trading inside a falling parallel channel. Currently, its price is retesting the $44.50 broken level which is acting as a resistance now.
The 50-day EMA is currently being tested and is stopping the price from moving up. The price is currently trading between the 50 and 200 EMAs, which shows that the price is currently facing pressure from both sellers and buyers.
The RSI line is just below its 50 level and is trending upward. If the RSI line faces resistance from its 50 level and starts to slope in the downward direction, then sellers could be seen taking back control of the price. However, if the RSI linecrosses above its 50 level then the price will remain under the control of the buyers. In such a scenario, the price could rise in the upcoming days.
In the current scenario, the CMCSA price is seen retesting the 50-day EMA and $44.50 resistance level. If the price reclaims the $44.50 level and closes above the 50-day EMA, then it may rise to its next resistance at $44.10. If it also breaks this resistance level, then its next resistance level is at $47.50.
However, if the price is unable to regain the $44.50 level or closes above the 50-day EMA while forming a bearish candle touching $44.50 and the 50-day EMA, it could potentially decline to its immediate support at $42.67. Further, if it breaks down below the $42.67 level, the next support might be at $40.00.
Conclusion
The 1-day chart for CMCSA indicates a bearish sentiment, despite the current price increase. This increase could be seen as a short-term recovery or a pullback. The price is currently testing the $44.50 level after breaking down from it. It’s also retesting the 50-day EMA.
If the price forms a strong bearish candle in the upcoming trading session, it could resume its decline. In that case, the price may drop to its two support levels at $42.67 and $40.00. However, if the price manages to reclaim the $44.50 level and the 50-day EMA, it could rise to its two resistance levels at $46.10 and $47.50.
Technical levels
Resistance Levels: $46.10 and $47.50.
Support Levels: $42.67 and $40.00.
Disclaimer
The views and opinions stated by the author or any other person named in this article are for informational purposes only. They do not provide financial, investment, or other advice. Investing or trading comes with a risk of financial loss.




