
 Quack AI
 NEAR Protocol
 Zcash
Zcash Celestia
 Pons
Pons Pudgy Penguins
 Bitcoin
- The Fantom coin price has formed a descending triangle pattern on the daily chart.
- The Fantom coin price has declined by over 64% in the last 6 months.
- FTM coin’s price has been trading below the 50-day and 200-day Exponential moving averages.
The Fantom Coin price is witnessing pressure along with the major cryptocurrencies. It has fallen by more than 3% in a week and month. That’s a sign of short-term bearishness. Soon after the listing, the coin price experienced a massive decline. It has fallen continuously since then and eroded over 94% of the gains.
The Fantom Coin price is forming some long wicks on both sides. It indicates that both buyers and sellers are trying to dominate each other but failing to do so. It is forming a lower high and lower low pattern, which confirms that the coin price is in a massive downtrend.
The Fantom Coin price showed some strength in December of the year 2022. It has shown a huge surge of over 280% in its price within a month. However, the price has again come under the control of the bears. Furthermore, the price is trading very close to the same level from where it started surging.
An Overview of the Fantom Coin Chart
The FTM coin price has been following a downward-sloping trendline on the daily chart. Now, the coin has been enclosing the gap between the resistance and support zone of the pattern. It indicates that the coin is soon going to give a breakout of this pattern on either side. The 50-day Exponential Moving Average is providing some good resistance to the price. Currently, the price is trading below the 50-day and 200-day exponential moving averages.
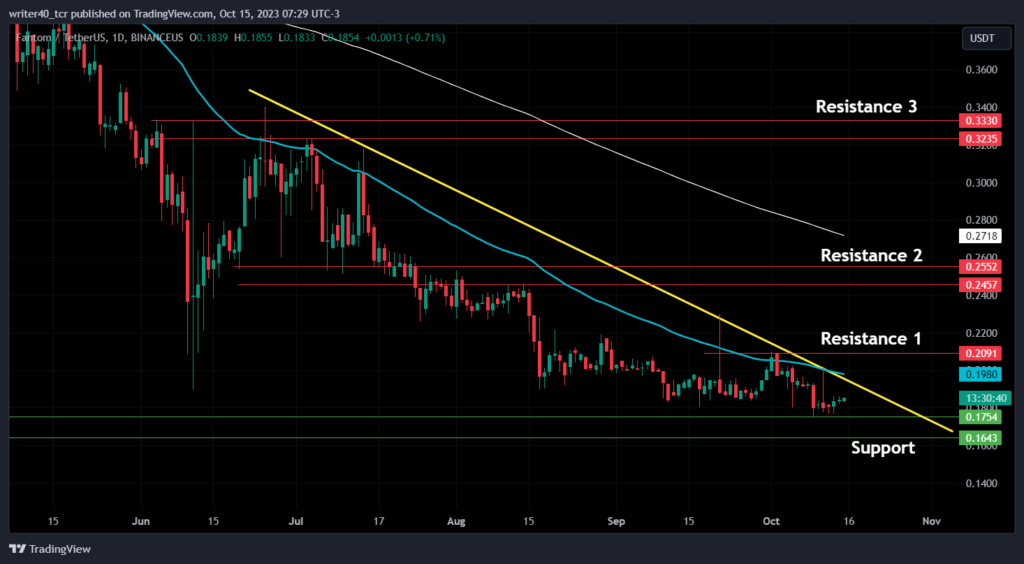
The FTM coin price is facing resistance near the level of $0.2091, from where the price has reversed twice recently. Apart from this, the other two resistances are present at the level of $0.2457 and $0.3235. If we consider the support level for the coin, it is present near the level of $0.1754.
A Quick Summary of the Indicators
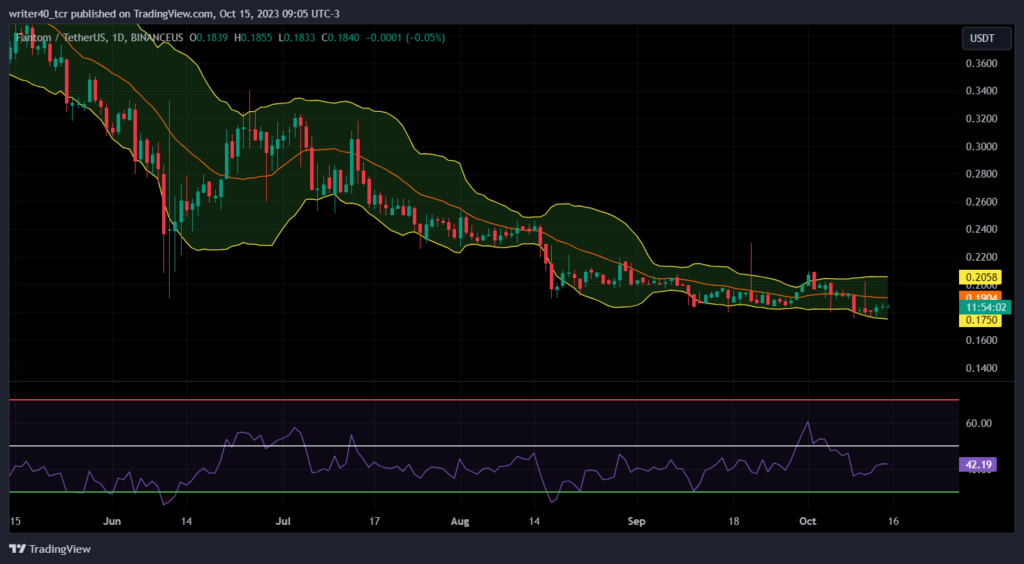
The Bollinger Band is currently enclosed, which indicates that the stock will witness less volatility ahead. The coin has formed some doji kind of candles near the lower band of the Indicator on the daily chart. It indicates that the investors are indecisive. If we examine the Relative Strength Index, it shows a divergence if we compare the previous swing low of 11th September. It is currently curving near the level of 42.19, which is considered a bearish momentum.
Conclusion
The FTM coin price seems like forming a bottom at the current level. The price can see some consolidation here and can face resistance near the level of $0.2091 and $0.2457. However, the $0.1754 will act as a crucial support level for the coin.
Technical Level
Resistance – $0.2091 and $0.2457
Support – $0.1754
Disclaimer
The views and opinions stated by the author, or any people named in this article, are for informational purposes only. They do not establish financial, investment, or other advice. Investing in or trading crypto assets comes with a risk of financial loss.




