
 Quack AI
 NEAR Protocol
 Monero
 Lighter
 Ethena
 Pons
Pons Sui
Sui
- The company’s share price is currently trading at $58.96.
- The SLB has recently made an agreement with two giant companies, which are Amazon Web Service and Shell Global Solutions.
Schlumberger N.V. (NYSE: SLB) is an oilfield service company. The firm deals in the drilling, production, and processing of oil and natural gas for the oil and gas industry.
Collaboration Of Three Giants.
On 13 October 2023, It was reported that Schlumberger N.V. had signed a three-way agreement with Amazon Web Service (AWS) and Shell Global Solutions Nederland.
The collaboration will help Shell Plc by providing it with a digital end-to-end workflow on the Amazon Web Service (AWS) Cloud framework. It strives to enable a cost-efficient and high-performance solution. It will be utilized by Shell and made accessible to broader industries.
This collaboration will further extend the existing partnership between SLB and AWS. It would also help each company stock to have a positive impact in the future.
Schlumberger N.V. (SLB) Stock Analysis
SLB’s current market share price is $58.96 with a 1.01% gain in its last intraday session. It is a large-cap company that has a market capitalization of 83.793 Billion USD.
Are Buyers Showing Their Presence in 1-Day Chart of SLB Stock?
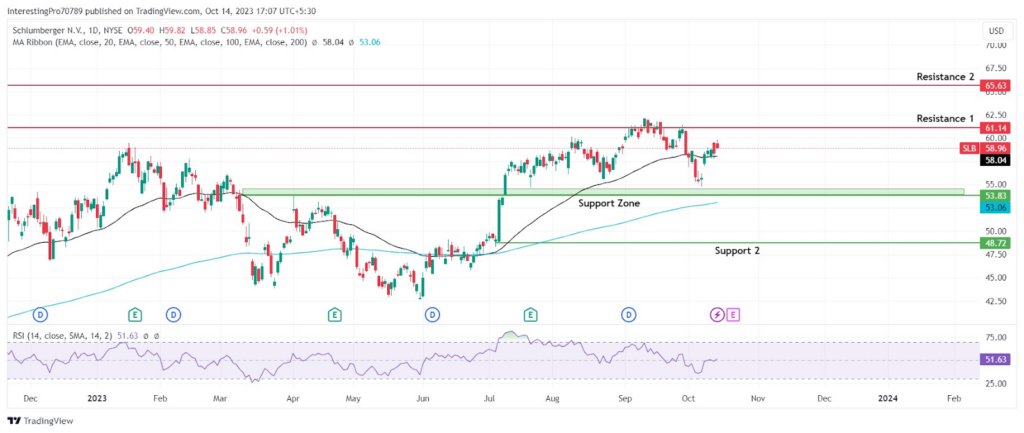
Currently, the SLB share price is consolidating in a wide range of $61.14 and $53.83. It is in bullish sentiment since it has given the breakout of the double bottom pattern in July 2023.
Recently, the price has taken support from the 50-day EMA and is sustaining above it. The 50 and 2000-day EMA lines are below the price, showing the buyer’s stronghold over the price despite the decline in price in the last two trading sessions.
The relative strength index is at 51.63, which is marked in neutral territory. However, the RSI line is sloping in the upward direction. It shows that the buying pressure is more than the selling pressure. It also indicates that it has more space in the upward direction to continue its further upward sloping. It’s also above its 50 level, which shows buyers have slightly more control over the price than the sellers.
In the current scenario, the SLB chart shows that the price can rise in the upcoming trading session. It is already in the bullish sentiment. If it gives the breakout of the $61.14 resistance, it may rise to its next resistance at $65.63.
The SLB stock price has sustained above the $53.83 level. Sellers can take control of the stock price if they make it close below the $53.83 level. Thus, the stock price may fall to its next support at $48.72.
Conclusion
The overall trend of the SLB is bullish. It could continue its bullish trend in the future. EMA lines and RSI show the bulls’ control over the price. In addition to the recent deal it has made with Shell Plc (SHEL) and Amazon Web Service (AWS). This agreement will positively impact its share price, which will help its share price to grow.
Technical levels
Resistance Levels: $61.14 and $65.63.
Support Levels: $53.83 and $48.72.
Disclaimer
The views and opinions stated by the author or any other person named in this article are for informational purposes only. They do not provide financial, investment, or other advice. Investing or trading comes with a risk of financial loss.




