
 Boomer
 Covenant x402
 Pearl
Pearl Claudia
 Solana
 Bitcoin
 Quantus
- Zillow Group Inc. (Z) stock has given a return of -6% in the last six months.
- Zillow Group has shown a decline in the quarterly profit margin.
- ZG stock’s ROA is currently at 2.7%, with a decline of -63% YoY.
Zillow Group, Inc. (NASDAQ: ZG) is involved in offering online and mobile platforms for real estate and home-related information markets. The company’s operations are categorized into three segments: Internet, Media, and Technology (IMT), Mortgages, and Homes.
The stock price of Zillow Group, Inc. is presently exhibiting a trend toward the downside. Recently, there has been a breakdown from the wedge pattern, signifying that the price of Z is shaping a less favorable structure.
Financial Data of Zillow Group, Inc. (NASDAQ: ZG)
The current trading value for Zillow Group stock stands at $42.5, with an average trade volume of 0.6 million and a share float consisting of 152 million shares.
ZG stock’s ROA has been notably negative at -2.7%, reflecting a YoY decline of more than 63%. Additionally, the Return on Invested Capital (ROIC) has also experienced a significant 49% decrease. These weakened financial indicators create a negative perception among investors regarding the company’s financial health.
It’s worth noting that Zillow Group does not issue dividends to its shareholders, which could be a drawback affecting the stock’s reputation and potentially discouraging new investments.
As the real estate market evolves, agencies need to adopt web scraping and other data-driven tactics to maintain a competitive advantage and succeed in this dynamic business. With Python tools, extracting and analyzing data from sites like Zillow is still very easy.
Over the last six months, the ZG stock price has seen a decrease of nearly -6%, highlighting a weak performance over the past year.
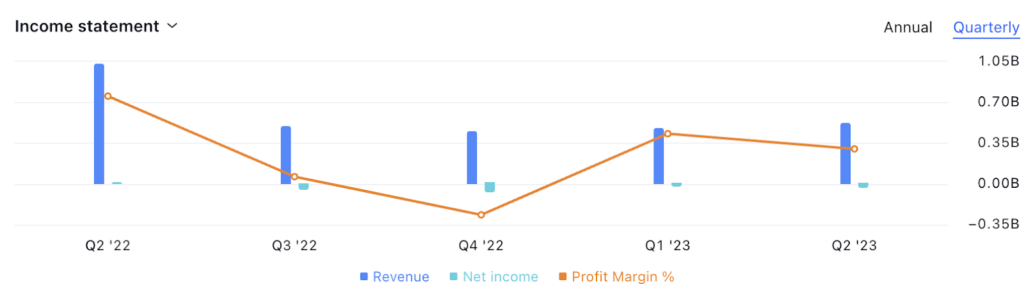
Notably, in Q2 2023, the company’s profit margin experienced a decline. The net income for has similarly shown a substantial decrease. In Q2 2023, the profit margin was -4.6%, which dropped to -6% in Q3. These declining figures represent an unfavorable signal for the stock’s performance.
Formerly, the ZG stock price adhered to a rising wedge pattern, but it recently witnessed a breakdown from this pattern. This development signifies a negative signal for the stock, indicating that the price is shaping a weak structure, with the potential for further declines in the near future.
Zillow Group Inc. (ZG) Technical Analysis
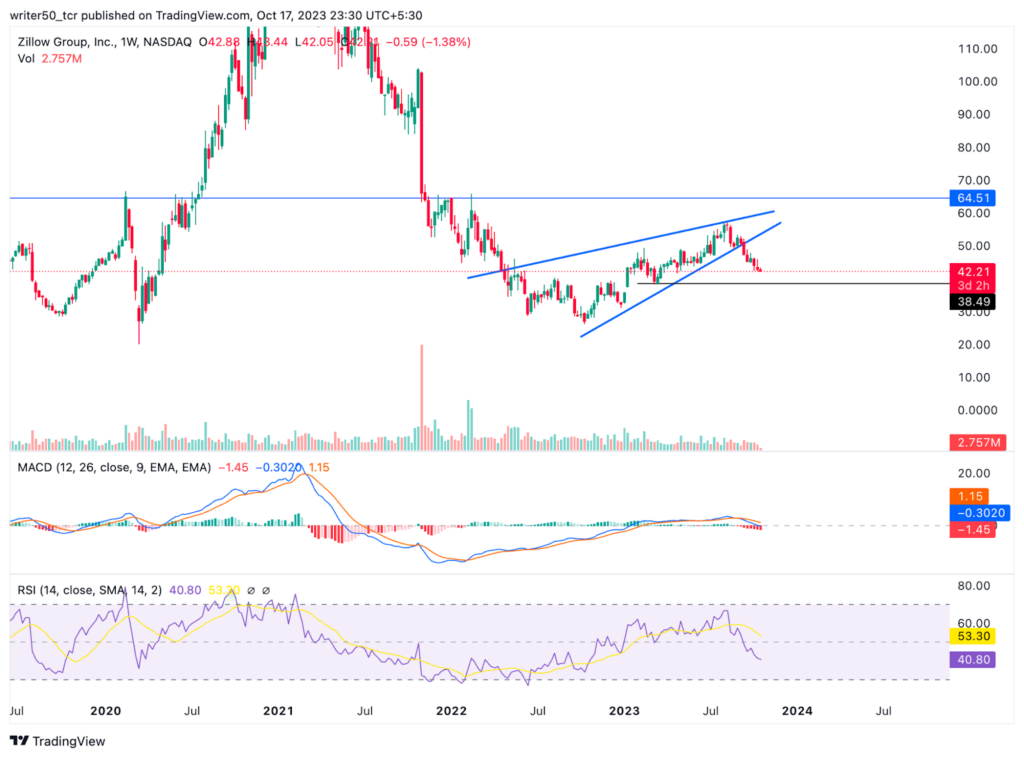
The MACD line is below the signal line. Also, there is the formation of a red histogram. This suggests that ZG stock is bearish and the price may fall in the next few days.
The RSI line is currently below the SMA line. Both lines are close to the 40 level. This is a negative zone and further indicates that the ZG stock price might fall in the upcoming days.
ZG Stock Chart By TradingView.com
Conclusion
In conclusion, ZG stock is showing signs of weak momentum. The price has recently given a breakdown from the wedge pattern. The indicators are giving a weak signal and the profit margin of the company has also declined. Thus, the price is likely to fall in the upcoming days.
Technical Levels
- Support Level: $38
- Resistance Level: $56.3
Disclaimer
The views and opinions of the author, or anyone named in this article, are for informational purposes only. They do not offer financial, investment, or other advice. Investing or trading crypto assets involves the risk of financial loss.




