
 Pearl
Pearl Bitcoin
 NEAR Protocol
 Starknet
 Solana
 Quant
Quant Ondo
Ondo
- Harley Davidson Inc.’s stock price has shown a decline of over 15% in a year.
- The quarterly profit margin of the company is declining.
Harley-Davidson, Inc. (NYSE: HOG) is involved in crafting and distributing personalized cruiser and touring motorcycles. The company’s operations are organized into two main segments: Motorcycles & Related Products and Financial Services.
The HOG stock price is currently following a downward trajectory, evident in the weekly time frame, as it continues to establish lower levels.
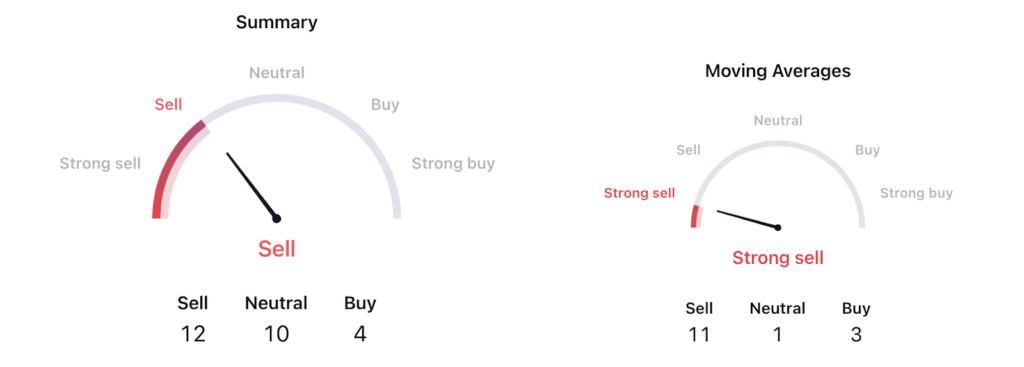
A technical indicator analysis conducted via TradingView indicates a prevailing ‘sell’ signal for the stock. Among the 26 indicators, the majority signal a ‘sell’, with only a few giving a ‘buy’ signal. Moreover, the moving averages summary offers a weak signal, suggesting a potential decline in the stock price.
The HOG stock stock price attained a peak of $74.13 in May 2013, and since then, it has been on a consistent downtrend. By the end of April 2020, the price had experienced a decline of 81%.
Nevertheless, HOG stock discovered support at the $14 level, marking a reversal of the downtrend. Subsequently, it staged a recovery of approximately 185%. However, this uptrend encountered resistance around the $81 level.
Presently, the stock is trading within a range, with the overall structure characterized by a negative outlook and a feeble pattern. There are indications of an impending price decline.
Furthermore, the stock has delivered a negative return of over 15% within a year, reflecting the company’s weakened financial performance and signaling a potential decline in the stock price.
Harley Davidson Inc. (HOG) Stock Price Analysis
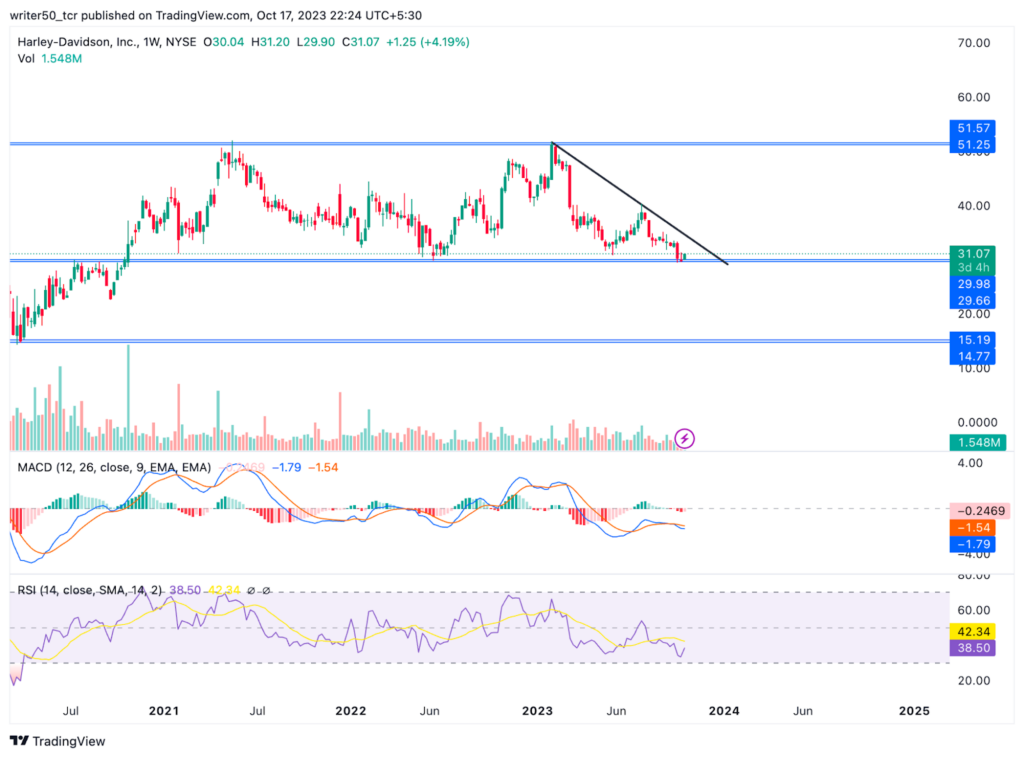
The MACD line resides below the signal line, while a red histogram configuration has taken shape. This combination points to the current bearish sentiment surrounding HOG stock, implying a potential price decrease in the future.
The RSI line currently finds itself beneath the 14-day SMA line. Additionally, both of these lines are positioned below the 40 level. This weakened state of the RSI line for HOG stock indicates an impending price decline.
HOG Stock Chart By TradingView.com
Conclusion
In conclusion, HOG stock is moving in a downtrend. The price has given a negative return in the previous year, along with the formation of a lower low pattern. The indicators are also providing a ‘sell’ signal, and so, the price is likely to decline in the upcoming days.
Technical Levels
- Support Level: $29
- Resistance Level: $50
Disclaimer
The views and opinions of the author, or anyone named in this article, are for informational purposes only. They do not offer financial, investment, or other advice. Investing or trading crypto assets involves the risk of financial loss.




