
 Quantus
 Pearl
Pearl Quack AI
 Starknet
 NEAR Protocol
 Zcash
Zcash Aerodrome Finance
- The RTX share price has corrected over 28% from its annual high.
- The stock price is in the recovery phase and approaching the $81.73 level to retest it.
RTX Corporation (NYSE: RTX) is an aerospace and defense company. It deals in the sales of aerospace and defense systems and services to the military and government. It is one of the largest aerospace and defense manufacturers by revenue and market capitalization.
RTX Corporation (RTX) Stock Analysis
The RTX’s share price is currently trading at $73.98. It gained 1% in its last intraday session, where it traded with a volume of 6.3 Million. It has one of the largest market capitalizations in the aerospace industry, which is worth 107.679 Billion USD.
1-day Price Analysis Of RTX Stock
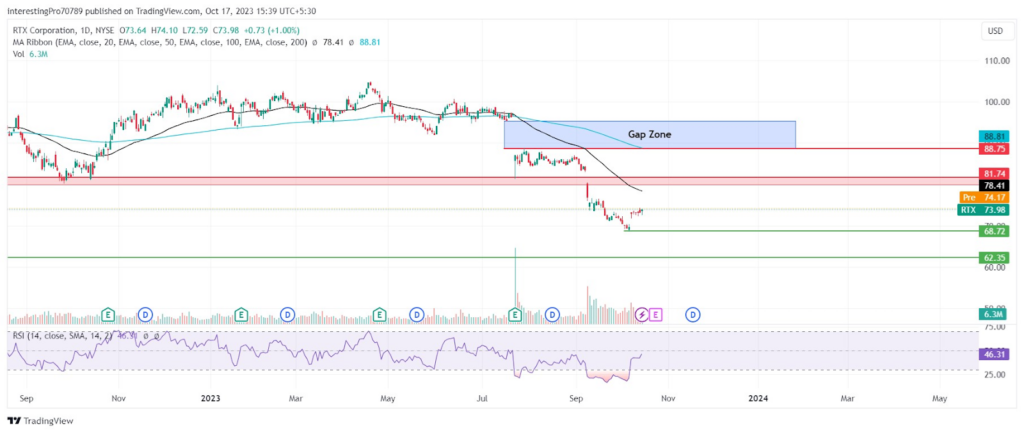
Currently, the RTX share price is in the recovery phase after giving the breakdown of the major support of $81.74. It is rising towards the $81.74 level, which is acting as a resistance now to retest it. There is a gap left above the $88.75 level, which has not been filled yet.
The 50-day and 200-day EMA lines show the dominance of sellers because both EMA lines are above the price. The price is currently approaching a 50-day EMA to retest it. If the price forms a strong bearish candle at the time of retesting the 50-day EMA, it may resume its long-term trend. Buyers can be in a dominating position if they succeed in closing the price above the EMA lines.
The RSI is below its 50 level, which is marked in bearish territory. However, the price is facing high buying pressure. It is making the RSI line move in the upward direction. If it struggles to rise above the 50 level, it will indicate decreased buying pressure. It will also denote that the seller can take the control back from the buyers.
The RTX share price is currently rising. It could also be considered as the recovery phase, which usually occurs after a breakdown of the support.
There are two major resistances of the 50-day EMA and the $81.74 level, which could stop the price from its further rise. If the price forms a strong bearish reversal candle while retesting resistance levels, the downtrend may continue. The stock price may reach immediate support at $68.72. For the continuation of a downtrend, it must close below $68.72 support. After that, it may fall to its next support at $62.35.
The RTX stock price can continue its current up-move if it reclaims the $81.74 level and EMA lines. It should also sustain above it by forming strong bullish candles. After that, the stock price can rise to its $88.75 resistance. It can also fill the gap left there.
Conclusion
The overall price sentiment of the RTX stock is bearish. The price is currently in the recovery phase as it is rising. There are two major resistances of 50-day EMA and the $81.74 level. It is anticipated that it could face rejection from these two resistances and could resume its downtrend.
Technical levels
Resistance Levels: $81.73 and $88.75.
Support Levels: $68.72, and $62.35.
Disclaimer
The views and opinions stated by the author or any other person named in this article are for informational purposes only. They do not provide financial, investment, or other advice. Investing or trading comes with a risk of financial loss.




