
 Quack AI
 NEAR Protocol
 Zcash
Zcash Celestia
 Pons
Pons Pudgy Penguins
 Bitcoin
- The SYM stock price is currently at $46.17.
- The stock price has increased by 6.17% in its last trading session.
Symbotic (NASDAQ: SYM) is a robotics warehouse automation technology firm. The company engages in rebuilding automated warehouse systems into cutting-edge physical structures for its clients.
Symbotic (SYM) Stock Price Analysis
At press time, the SYM stock price gained 6.17% in its last intraday session and its current market price is $46.29. SYM stock traded with a volume of 1.882 Million in its last trading session. Symbotic is a small-cap firm with a market capitalization of $3.743 Billion.
1-Day Chart Price Analysis of Symbotice Inc (SYM) Stock
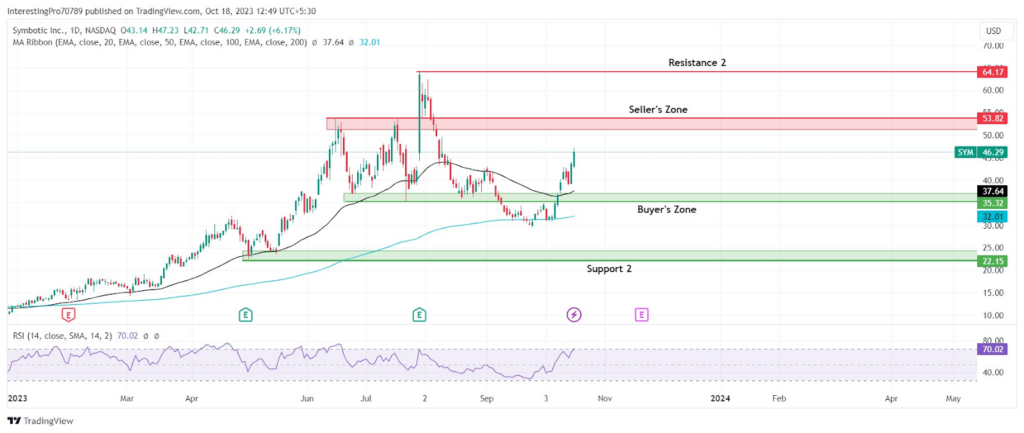
SYM stock is currently trading in a wide range between $53.82 and $35.32. Previously, the price gave the breakdown of the $35.32 support zone. Despite the strong selling pressure, the buyers reclaimed the support zone and took control of the price. The price has risen by 31.52% since it reclaimed the support zone.
The price is currently rising by forming higher highs and is reaching the resistance level at $53.82.
The 50-day and 200-day EMAs are below the price, showing the stronghold of buyers. The price has recently taken support from the 50-day EMA and has formed two back-to-back bullish candles. This shows that the buyers are strongly controlling the price.
The relative strength index (RSI) is at 70.02, which is a bullish territory. The RSI line is sloping in the upward direction, indicating the high buying pressure. However, it is approaching the overbought territory from where a small pullback is expected in the future.
The price can be seen retesting the $53.82 resistance level. However, the RSI is pointing towards a pullback which could happen in the future. The price could be seen facing resistance from the $53.82 level as the RSI is heading toward the overbought territory. For the continuation of the current bull run, the price must close above the $53.82 seller’s zone. Thus, after this it could rise to its next resistance at $64.17.
However, for the price to gain bearish momentum, it has to give the breakdown of the various levels which will act as a support for the price, such as the 50-day and 200-day EMAs and the support level of $35.32. If it gives the breakdown of all these supports, then the sellers would take control of the price. After this, the price could fall to its next support level at $22.15.
Conclusion
The SYM stock price is currently making a bull run by taking support from the 50-day EMA. The price could be seen retesting the $53.82 resistance level. However, it could face resistance from there as the RSI is indicating that a pullback could occur in the future. The technical indicators mentioned above are currently in the bulls’ favor.
Technical levels
Resistance Levels: $53.82 and $64.17.
Support Levels: $35.32 and $22.15.
Disclaimer
The views and opinions stated by the author or any other person named in this article are for informational purposes only. They do not provide financial, investment, or other advice. Investing or trading in crypto comes with a risk of financial loss.




