
 Minter
 Sui
Sui Pons
Pons NEAR Protocol
 Starknet
 Quack AI
 Chainlink
- CHTR price is more likely to perform in an ascending triangle.
- The trading oscillator had shown some signs of bearish divergence.
Charter Communications, Inc. (NASDAQ: CHTR) is a leading broadband connectivity company with services branded as Spectrum. It is one of the largest cable operators in the United States of America. The company offers internet, voice, and video services to commercial and residential customers by providing entertainment and broadband communications.
An Overview of the Stock and Financial Performance
The stock has observed a fall of more than 60% since September 2021. Recently, it is showing some signs of recovery of its price value from the past declines. Although, due to the company strong financials, stock got a strong background support.
According to the second quarter 2023, the firm has experienced some negative profitability in its statement as per the year-to-year change. However, despite being in a negative decline, CHTR stock price surged more than 19% in the third quarter provides a positive look.
In this current month, the price seems to be consolidating above the breakout range of $416.76. On the side, the stock has a yearly target of $500.00 which is more closer as compare to the yearly low range of $302.21.
CHTR stock has a pretty good P/E ratio of 15.06 along with a earnings-per-share (EPS) at $29.77. The total market capitalization of the stock stands at $67, 100,476,717 with an average volume of 1,092,526.
Technical Analysis of the CHTR Stock
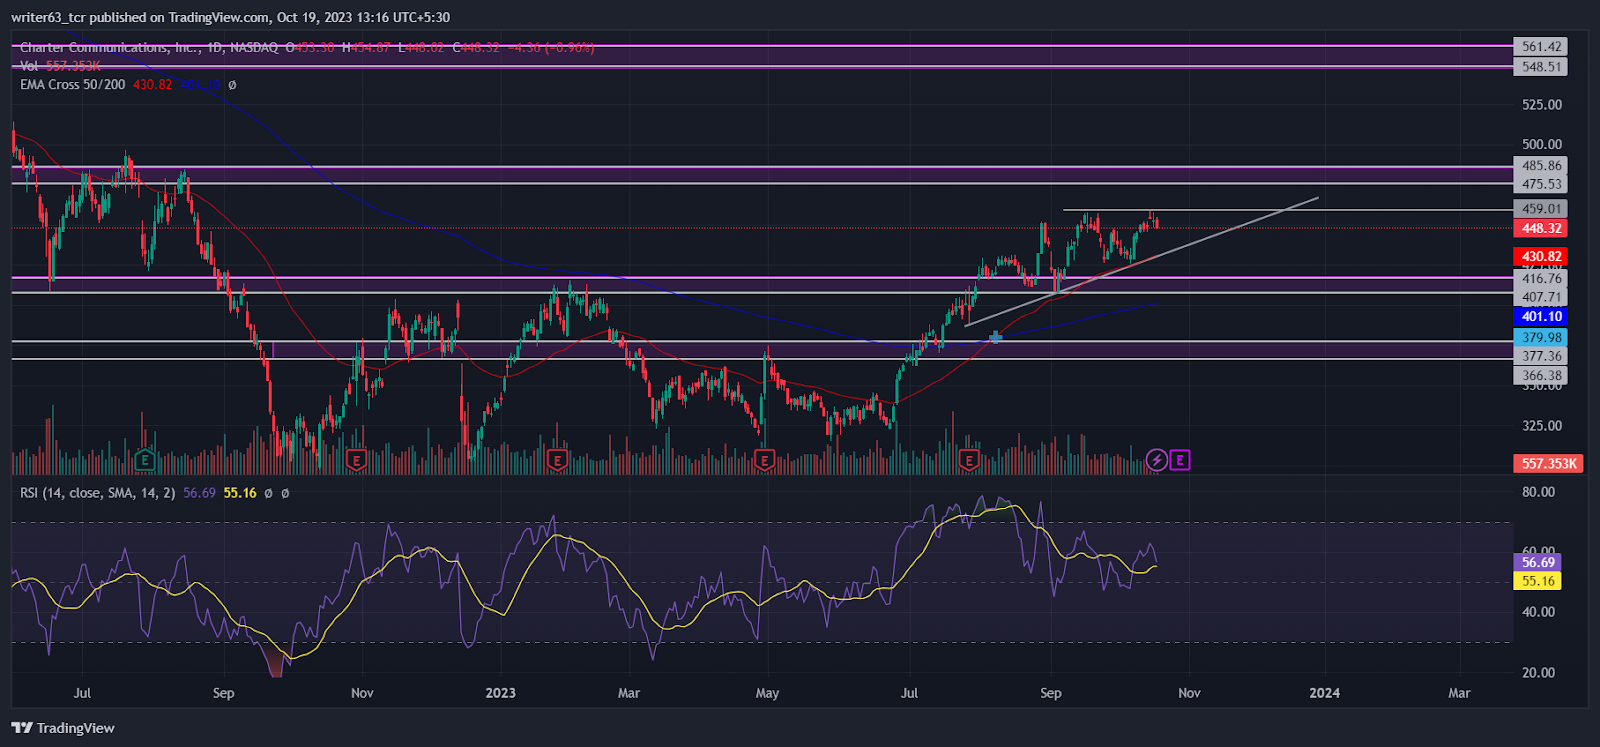
After being in an downtrend since years, CHTR price is getting strong bullish responses from the EMAs. At present, the price is performing in an uptrend, which got a strong indication from a bullish crossover of the 50-day EMA and the 200-day EMA. the 50-day EMA is at the level of $430.82 and the 200-day is at $401.10.
At press time, stock price is trading within a ascending triangle which faced resistance from the $459.01. Recently, the price has came out from the yearly long downtrend by giving a breakout of the pivotal level of $416.76. Now, because of the recent upsurge, the price is expected to break above the ascending triangle. The expected resistance levels are $475.53 and $548.51.
However, the relative strength index (RSI) has shown signs of bearish divergence which is leading Bears into a low probability direction. At current, the RSI is sloping at 56.69 between 50-Mark and the 70-Mark bands.
Conclusion
According to the technical data, the CHTR stock price is currently performing in an uptrend. Therefor, the price prediction for the stock will be bullish. At press time, it is trading within a ascending triangle with a expected high probability breakout. So, if it gives a breakout from this pattern, it may rise to the $475.53. And, if the price also manages to break above the $485.86 level then it may rise toward the yearly target price of $500.00.
Technicals Levels
- Resistance levels: $475.53 and $548.51
- Support levels: $407.71 and $366.38
Disclaimer
The views and opinions stated by the author, or any person named in this article, are for informational purposes only. They do not establish financial, investment, or any other advice. Investing in or trading stocks comes with the risk of financial loss.




