
 Minter
 Pearl
Pearl NEAR Protocol
 Pons
Pons Quack AI
 Quantus
 Sui
Sui
- GSK stock price is currently recovering from its past declines.
- Moving averages are showing signs of a strong bullish rally.
GSK Plc (LON: GSK) is a multinational pharmaceutical and biotechnology company headquartered in the United Kingdom. It is one of the largest pharmaceutical companies in the world. The company focuses on developing, manufacturing, and commercializing important medicines, general medicines, specialty medicines, and vaccines.
Financials and Stock Performance of the Company
The company has been performing pretty well compared to the last few years. It has generated a total revenue of £29.32 Billion with an increase of 18.74% in the year 2022. However, the GSK stock price experienced a decline of more than 30% in the middle of 2022.
According to the quarterly data, the firm has managed an increase in profitability as per the year-to-year change. It has reported its revenue as £7.18 Billion along with an increment of 87.10% in its net profit margin.
On the other hand, the GSK stock price increased by the investors up to 19% in the third quarter of 2023. This signifies the positive approach of buyers after the release of strong quarterly statements.
The GSK stock price is currently trading at £1470.2 while observing a decrease of 1.66% during the intraday trading session. The current market capitalization of the stock stands at £60.88 Billion with an average volume of 6.97 Million.
Market Technicals of the GSK Stock
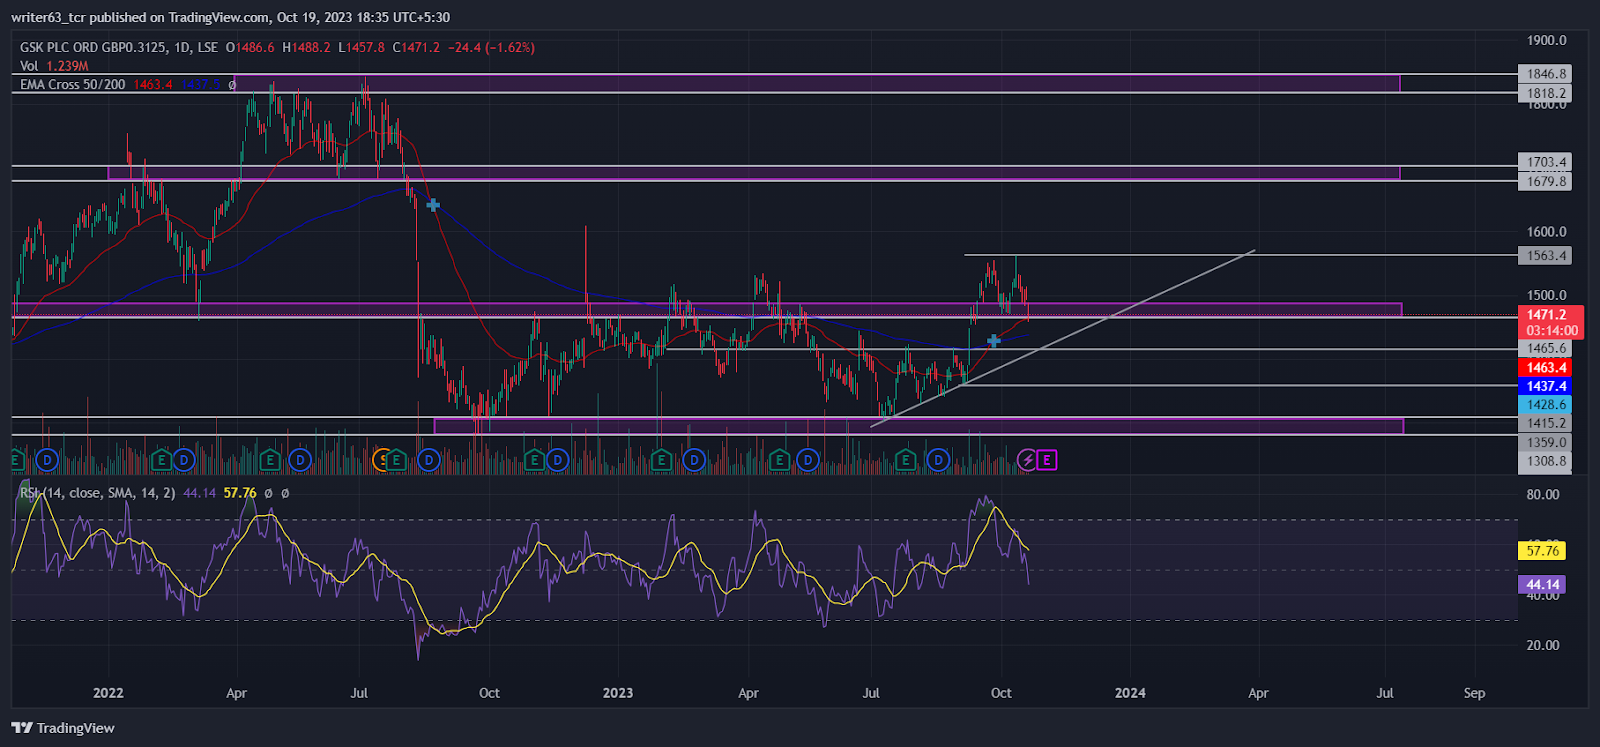
GSK stock price is trading above the 50-day EMA and the 200-day EMA indicating an uptrend. In the wider outlook of the chart, the 50-day EMA just made a bullish crossover with the 200-day EMA. this reflects a strong bullish trend. At present, the 50-day EMA has become a strong support line.
At press time, the price has given a breakout from the pivotal resistance level at £1488.0. By forming a double top, it is relocating itself toward the trendline formed below at the £1415.2 level. If the GSK stock price gives a rejection from that level, it may rise toward the immediate resistance at £1563.4. If it also breaks above that resistance then, it may reach its next resistance at £1679.8.
Furthermore, the relative strength index (RSI) is showing a bearish divergence which probably intrigues Bears in taking positions. At present, the RSI is sloping at 42.19 below the signal line.
Conclusion
Overall, the GSK stock price has come out from a £1488.0 pivotal level. Now, it is trading in an uptrend reflecting the bulls’ dominance over the price as of right now. Therefore, the price prediction for the stock price will be bullish. At present, By forming a double top, the price is relocating itself toward the trendline formed below at the £1415.2 level. If the GSK stock price gives a rejection from that level, it may rise toward the immediate resistance at £1563.4. If it also breaks above that resistance then, it may reach its next resistance at £1679.8.
Technicals levels:
- Resistance levels: £1563.4 and £1703.4
- Support levels: £1415.2 and £1359.0
Disclaimer
The views and opinions stated by the author, or any person named in this article, are for informational purposes only. They do not establish financial, investment, or any other advice. Investing in or trading stocks comes with the risk of financial loss.




