
 Minter
 Quack AI
 NEAR Protocol
 Pearl
Pearl Sui
Sui Pons
Pons Quantus
- Union Pacific Corporation stock price has surged by posting better results than expected in Q3.
- Goldman Sachs maintained its previous rating of “BUY” for UNP stock.
- The Union Pacific Corporation stock price has endured in a range between $235 and $180.
Union Pacific Corporation (NYSE: UNP) stock has been in a sideways trend since 2022. In the current trading session, the stock price is in favor of bulls, with a rise of $6.35 or 3.09%. It shows that the buyers are aggressively creating a long position at the moment. Whether it is serious buying for the long term or just a temporary rise in price, it will be interesting to watch.
In the third quarter of 2023, Union Pacific Corporation achieved an impressive financial performance. The company’s net income has surpassed market expectations, with reported earnings per share of $2.51, exceeding the anticipated $2.45 per share. However, when compared year-over-year (YOY), there is a slight decline in profit. The company had reported a net income of $3.19 per share in Q3 2022.
Union Pacific Corporation stock has been rated by the rating firm Goldman Sachs, and the latter has maintained its previous “BUY” rating. However, it has also cut down the target price of the stock from $240 to $230. The stock price has reacted positively as the price has already surged by over 7% after the rating. The current market price of the stock is $212.24, which is still 8% lower than the target price.
Outline of the Union Pacific Corporation Stock Chart
The UNP stock is moving in a range, and currently, it is trading in the middle of this range. It is being supported by the rising trendline which currently exists around the $200 level. The stock showed a very nice bounce after touching this trend line and from there it went up by about 10%. It means that the stock price is following this trend line perfectly and buyers are actively present there.
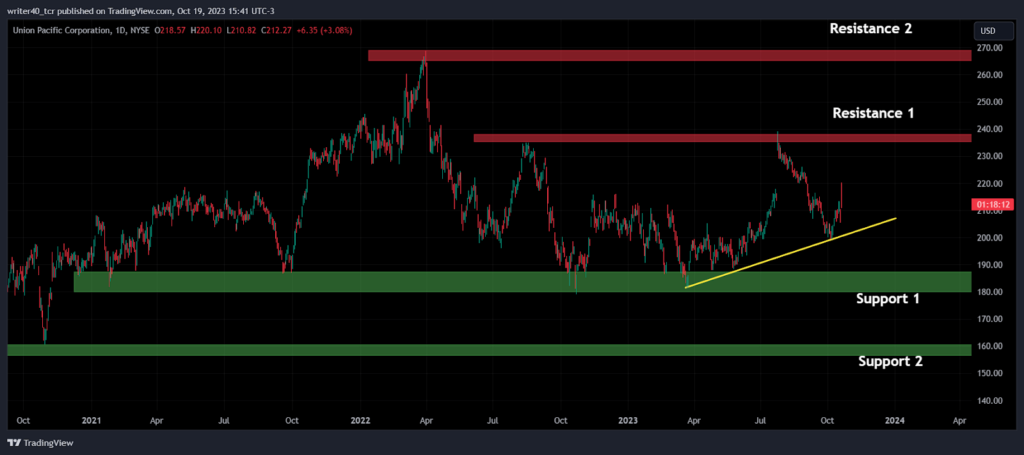
The UNP stock price has shown some bearish sentiment in recent times. it has fallen down from the $240 level to $200 in a relatively short period. The resistance levels for the stock price are present at $238.80 and $268.95. These levels are marked as resistance 1 and resistance 2, respectively on the chart. If we examine the support levels, then they are present at $179.14 and $160.8.
An Overview of the Technical Indicators
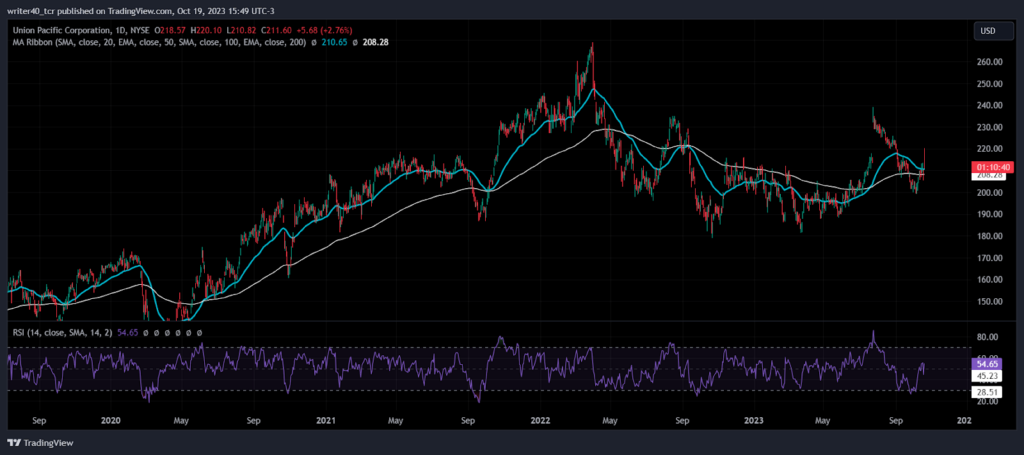
The UNP stock price is situated above the 50-day Exponential Moving Average (EMA) and close to the 200-day EMA. The slope of the EMA has been flat for a long time which confirms that the stock is in a sideways trend. The relative strength index (RSI) is currently placed at the level of 54.65, which is considered bullish. However, the RSI line is curving down, which signifies that the bulls have lost momentum and the bears are trying to catch up.
Conclusion
The recent development in UNP stock can boost the price in the near future. Furthermore, the stock price has shown some strength at the lower levels. It has been consolidating in a range and it seems like the stock will soon break out from this.
Technical level
- Resistance – $238.80 and $268.95
- Support – $179.14 and $160.8
Disclaimer
The views and opinions stated by the author, or any people named in this article, are for informational purposes only. They do not establish financial, investment, or other advice. Investing in or trading crypto assets comes with a risk of financial loss.




