
 Minter
 Quack AI
 NEAR Protocol
 Pearl
Pearl Sui
Sui Pons
Pons Quantus
- ETSY stock has been following a strong downtrend for a considerably long time.
- Etsy Inc.’s current market cap is $8.353 Billion, which is consistently declining.
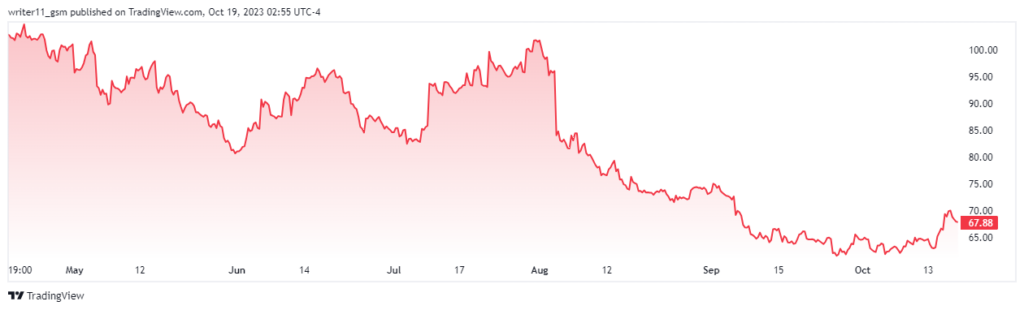
The Etsy Inc. (NASDAQ: ETSY) is an e-commerce company founded in the year 2005. The current CEO of the company is Joshua G. Silverman and the company has more than 2.7K employees. Etsy Inc. has its headquarters in New York and it was founded by Robert Kalin, Jared Tarbell, Chris Maguire, and Haim Schoppik.
The financial ratios of the company reveal a poor condition of the company as it has a highly negative debt/equity ratio of -514.67%, as recorded by FinancialModelingPrep.com. The ROA of the company is also negative at -27.92%, resulting in a negative price-to-book value of -18.06.
The average trading volume for ETSY stock in the last three months was 3.43 Million, with 3.07 Million shares traded in the last trading session. The gross margin of the company is 70.64%, and it has a negative EPS of -$5.88, which indicates that the company is incurring losses on each share.
Etsy Inc. Stock Performance Analysis
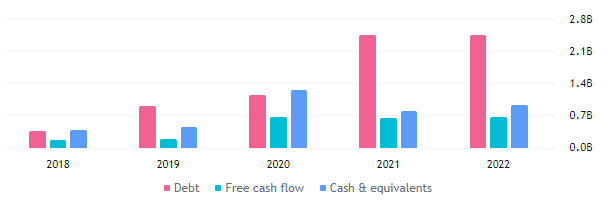
The reported revenue of Etsy Inc. for the year 2022 is similar to its reported debt, which is a negative factor for the sustainability of the company. It has reported a negative profit margin of -27.06% resulting in a negative net income of -$694.29 Million. The reported net cash at the company in Q2 2023 is $841.51 Million.
Analyst Rating For ETSY Stock
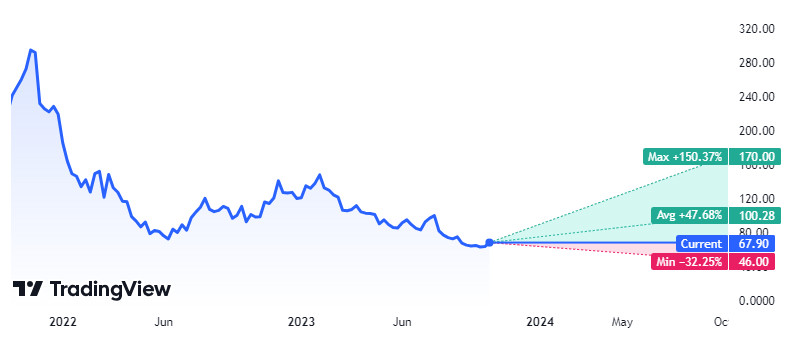
Experts on TradingView have set their sights on higher price targets, with expectations of an average stock price around $100.28, representing an increase of up to 150.00% on the higher side. The current stock price is trading at a 47% discount to this projected average. This shows that ETSY stock is currently trading in a downtrend.
What Can Be the Next Probable Move of ETSY Stock After Spike in Price?
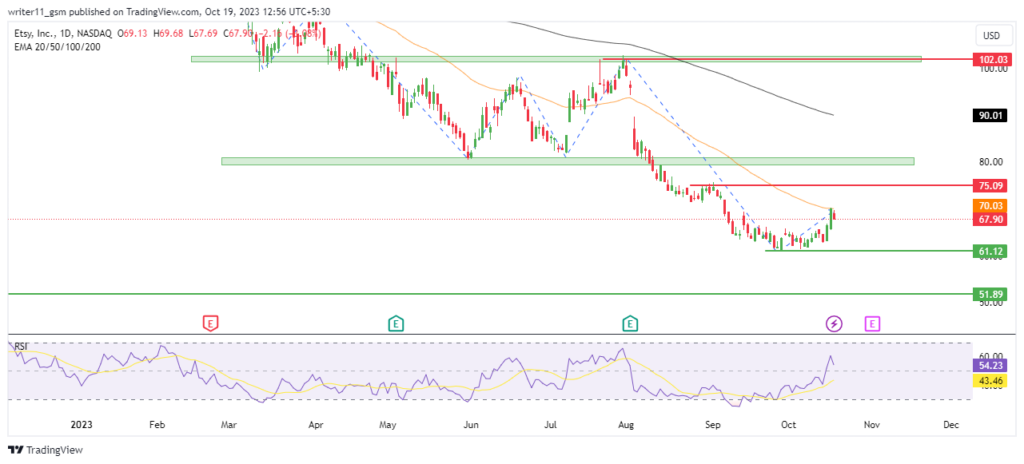
The ETSY stock price is consistently declining from the higher levels, making lower lows and lower highs. It is following a very strong downtrend and the price has been declining since November 2021. The stock has not made any significant bullish pattern since then which could lead the price to the higher levels.
Recently, the stock consolidated in a zone for a short period of time. The ETSY stock price later broke down below the consolidation zone and has steeply declined to lower levels. It has recently made two bullish candles on the daily time frame, hitting the 50-day EMA.
The stock price is currently taking resistance at the same EMA. Subsequently, the appearance of a death cross on the charts is signaled by the 50-day and 200-day EMAs. This configuration indicates a bearish trend in the market.
The RSI s is indicating a bullish signal as it is above the 50-level which is known as the neutral zone.
Conclusion
Despite an advance in the revenue of the company, the stock price has not been increasing. This could be because the debt of the company is similar to the revenue. On the technical charts, ETSY stock looks very weak and the EMAs have formed a death cross pattern. However, the RSI is currently going against the prevailing outlook, hinting at bullish momentum.
Therefore, ETSY may continue to decline to further lower levels if it breaks below the level of $65.50 and the RSI breaks below the 50 level.
Technical Levels
- Support levels- $52.00 and $61.00
- Resistance levels- $75.00 and $102.00
Disclaimer
The information provided in this article, including the views and opinions expressed by the author or any individuals mentioned, is intended for informational purposes only. It is important to note that the article does not provide financial or investment advice. Investing or trading in cryptocurrency assets carries inherent risks and can result in financial loss.




