
 Boomer
 Covenant x402
 Pearl
Pearl Claudia
 Solana
 Bitcoin
 Quantus
- The MTC share price has risen by 325.57% in its last 5 trading sessions.
- The company has decided to hold its 2023 annual meeting in November 2023 for its shareholders.
MMTec Inc. (NASDAQ: MTC) provides a platform that helps financial institutions engage in securities market transactions and settlements globally. The firm operates through two segments which are Gujia and MM Global. It also provides services like investment advisory and serves hedge funds and mutual funds. Its headquarters is in Beijing China.
MMTec (MTC) Stock Price Analysis
MMTec share price is currently trading at $2.06 and increased by 51.47% since its last trading session. Where it traded with 14.9844 Million trading volume. It is a small-cap company with a market capitalization of 410.239 Million USD.
1-day Analysis of MTC Chart
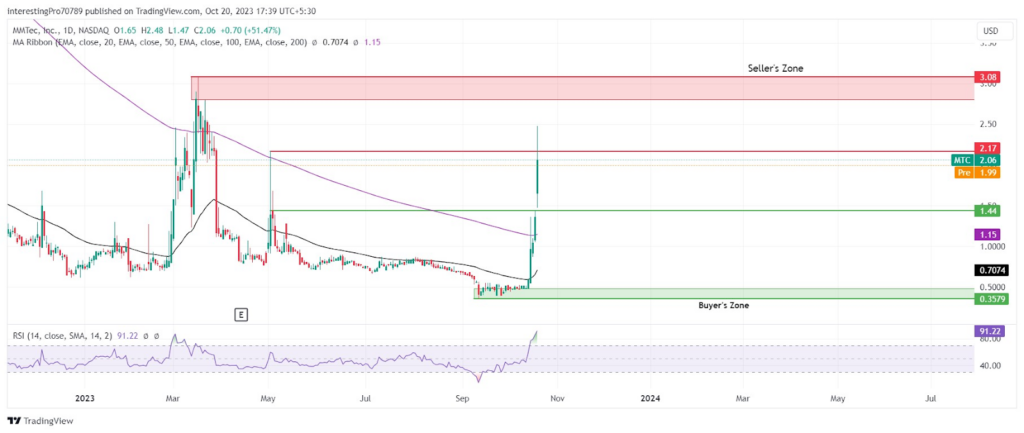
MTC’s share price has shown bullish sentiment in its last s trading sessions where it increased by 325.57%. Currently, it is facing rejection from its $2.17 level and could reach its $3.08 resistance zone.
The price is trading below the 50-day and 200-day EMA and is showing the overall control is in the bull’s hand. However, it is trading far from the EMA which indicates a small pullback or consolidation phase in the MTC chart.
The relative strength index has reached its overbought territory. Showing the very high buying pressure which could lead to a small pullback in the near future.
The overview of the price movement shows that the price can fall in the upcoming trading session as it seems like it has exhausted and is facing resistance from the $2.17 level. The RSI is also pointing toward the fall in price as it is in the overbought territory. The price could seen retesting the $1.44 level and if it breaks below this level, then it may fall to its next support at $0.3579.
As long as the price is sustained above $1.44 it can bounce back from there to retest the $2.17. If it gives the breakout of the $2.17 level then it may rise to its next resistance at $3.08.
Conclusion
The MMTec price prediction is bearish as the 1-day chart is signaling the fall in price in the upcoming trading session. The price could fall to test the $1.44 level in the short term. If it sustains above it then it would resume its uptrend. Otherwise, it could be seen falling to its next support zone at $0.3579.
If the price is sustained above $1.44 it can bounce back from there to retest the $2.17. For the continuation of the uptrend, it must give the breakout of the $2.17 level then it may rise to its next resistance at $3.08.
Technical levels
- Resistance Levels: $2.17 and $3.08.
- Support Levels: $1.44 and $0.3579.
Disclaimer
The views and opinions stated by the author or any other person named in this article are for informational purposes only. They do not provide financial, investment, or other advice. Investing or trading in crypto comes with a risk of financial loss.




