
 Minter
 Quack AI
 Quantus
 Pudgy Penguins
 Bitcoin
 Bittensor
 Boomer
- The PRU share price is currently trading at $93.29.
- The company chart reflects the bear’s control in the current scenario.
Prudential Financial Incorporation (NYSE: PRU) is a financial service company. The firm provides services like Retirement planning, Investment Management, and insurance to its customers. The organization operates through the following segments: PGIM, US Business, International Business, Corporate, and Close Blocks.
Prudential Financial, Inc. (PRU) Stock Analysis
The PRU’s share price closed its last trading session at $93.29 a decline of 1.6% with a traded with a volume of 1.26 Million. It is a mid-cap company with a market capitalization of 33.864 Billion USD.
1-Day Chart of PRU Stock
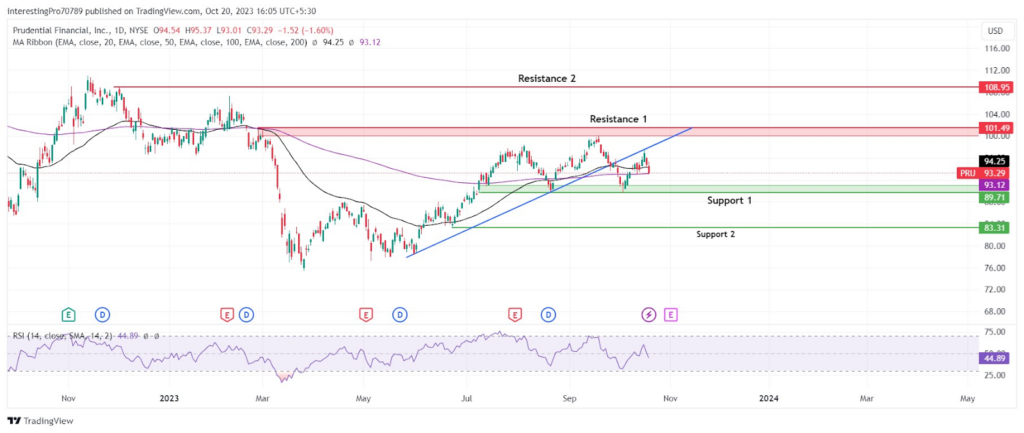
The PRU share price is consolidating in a range of the $101.49 resistance zone to the $89.71 support zone. It seems to forming a head and shoulder. It has recently retested the ascending trendline and after retesting the trendline it started to fall, it is currently approaching its $89.71 support zone. it has declined by 2.95% in the last two trading sessions.
In the last trading session, the price faced rejection from the 50-day EMA and has reached the 200-day EMA. If the next candle closes below the 200-day EMA line it will fall to its $89.71 support zone without any obstacle. It will also be a sign of bears to take full control of the price.
The relative strength index is at 44.89 which is the neutral territory. However, the RSI line is sloping in the downward direction showing the ongoing high selling pressure.
The price has formed a head and shoulder pattern. It is declining after it retested the ascending trendline and has formed two back-to-back bearish candles. If the next candle closes below the 200-day EMA line, it may fall to its immediate support zone at $89.71. For the continuation of the downtrend, it must close below $89.71 support. After which it may fall to its next support at $83.31.
However, the bull controls can only be seen if they manage to close the price above the $101.49 level. Then only a long-term bull run can be seen where its first resistance will be $108.95.
Conclusion
The current price behavior shows that bears are slightly more than the bulls in the current scenario. The price seems to be forming a head-and-shoulder pattern and is trading in the range of $101.49 to $89.71. Currently, it is falling to its $89.71 support zone. If it gives the breakdown of this level, then it could be seen continuing its downtrend.
Technical levels
- Resistance Levels: $101.49 and $108.95.
- Support Levels: $89.71 and $83.31.
Disclaimer
The views and opinions stated by the author or any other person named in this article are for informational purposes only. They do not provide financial, investment, or other advice. Investing or trading in crypto comes with a risk of financial loss.




