
 Minter
 Quack AI
 Pearl
Pearl Pons
Pons Bittensor
 Ethena
 Quantus
- In the last five years. LI Stock has given more than a 100% return.
- Li Auto Inc. stock has a lower beta of 0.71, which makes it volatile.
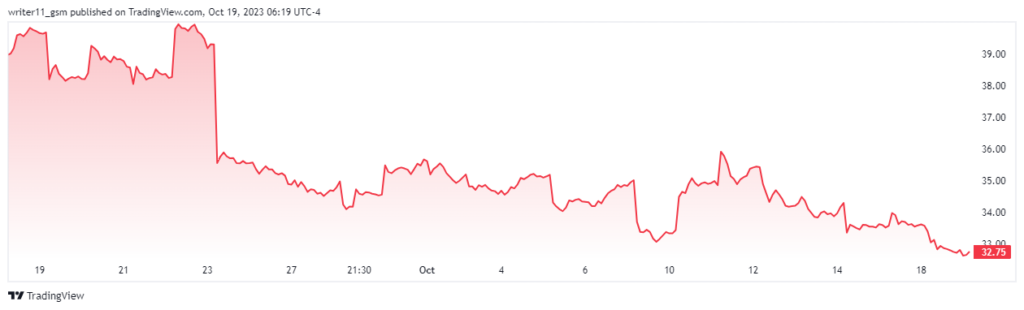
Li auto Inc. was founded by Li Xiang who is also the chairman and the CEO of the company. The company was founded 8 years ago in the year 2015 and got listed on NASDAQ in the year 2020. The company’s stock is traded with the ticker name LI and it has sold more than 100K vehicles worldwide in the year 2022.
In the last 10 days, LI stock is trading with an average volume of 4.461 Million and the volume of the stock in the last trading session was 3.341 Million. Currently, 800.845 Million shares of LI stock are freely floating in the market available for trading while 17.139 Million shares are closely held by the insiders and investors.
All of the revenue of Li Auto Inc. comes from China and the company does not pay any dividend to its shareholders. Additionally, the company has various neutral financial ratios following an ROE of 3.99% and an ROA of 1.78%. The operating margin of the company is also neutral at 5.67%.
Li Auto Inc. Stock Performance Analysis
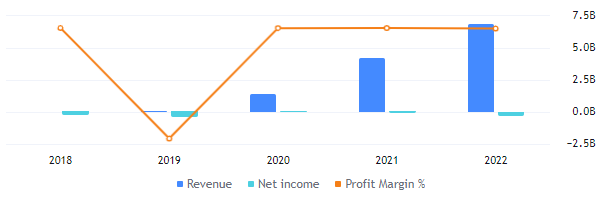
Li Auto Inc. is new in the market and its revenue has recently started to advance, witnessing growth each year. It has reported a revenue of $6.73 Billion in the year 2022. The debt for the company has also advanced to $1.76 Billion. It also has reported a huge increase of 209.1% in its revenue in the second quarter of 2023.
Analyst Rating For LI Stock
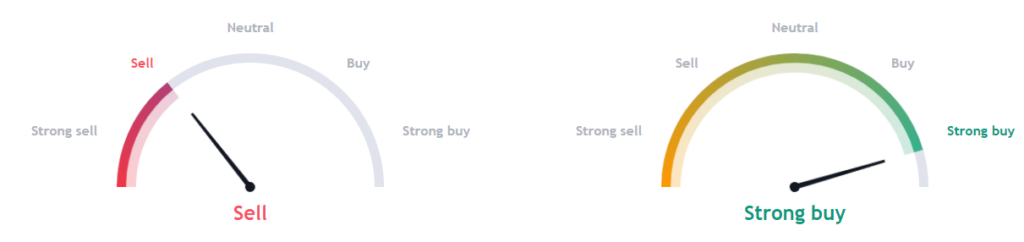
While the technicals of the stock are negative, the experts are highly bullish on the stock, aiming for higher prices. The technical indicators such as the moving averages and the oscillators are bearish on the daily charts, indicating the possibility of the price declining.
How Deep Can LI Stock Go Following the Downtrend?
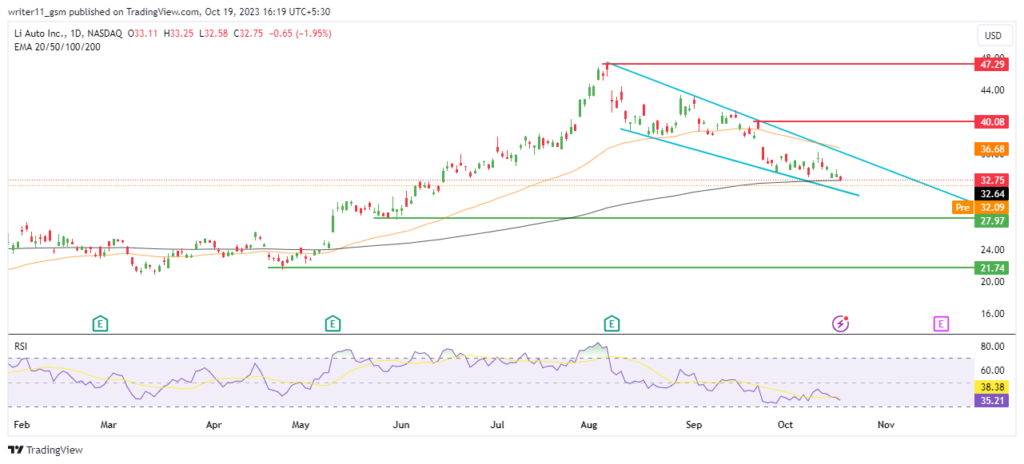
The LI stock price was consistently advancing to higher levels with a very good upward move which began from the beginning of November 2022 and reached a peak price of $47.33 on 07th August 2023. Since then, the stock changed its trend by consistently declining to lower levels.
The LI stock price is currently trading inside a falling wedge pattern and the price is declining to lower levels. Furthermore, LI stock has formed a bearish candlestick pattern on the charts which indicates the dominance of sellers in the market.
The 50-day and the 200-day EMAs form a golden cross. Despite this, the stock price has declined below the 50-day EMA and is currently trading near the 200-day EMA. Based upon the current price action, the probability of the stock breaking down below the 200-day EMA is high.
The RSI is acting bearish as it is below the 50-level. It has also declined below the 14-day SMA.
Conclusion
Li Auto Inc., despite being a relatively new company in the market, has shown promise and reliability. Its stock price has experienced significant growth in the past. However, current technical indicators suggest a bearish trend on the charts. Unless the price breaks above the falling wedge pattern, it may continue to decline.
Technical Levels
- Support levels- $21.70 and $28.00
- Resistance levels- $40.00 and $47.30
Disclaimer
The information provided in this article, including the views and opinions expressed by the author or any individuals mentioned, is intended for informational purposes only. It is important to note that the article does not provide financial or investment advice. Investing or trading in cryptocurrency assets carries inherent risks and can result in financial loss.




