
 streamoors
 IGNITION
 NEAR Protocol
 Injective
 LayerZero
 Pearl
Pearl Hyperliquid
- The Hershey Co. stock price is trading at $198.4 with a decline of 0.5%.
- Hershey Co. (HSY) has shown a return of 15% in the last year.
- The price of the HSY has created a strong bearish pattern.
The Hershey Company specializes in producing and promoting a wide range of confectionery items, including chocolates, sweets, and mints. Its operational divisions are categorized into North America International and Other, each catering to specific geographic regions.
The HSY stock is currently valued at $198.4, experiencing a slight decline of 0.5% in today’s market session. It boasts an average trading volume of $1.5 million and has a share float of 149 million shares.
Presently, the HSY stock exhibits a downtrend pattern after reaching a recent high, indicating a bearish trajectory. Over the past year, the stock has witnessed a considerable decline of approximately -15%, with a recent fall of -2% over the last three months. These declines signify a bearish sentiment and a market presence of sellers.
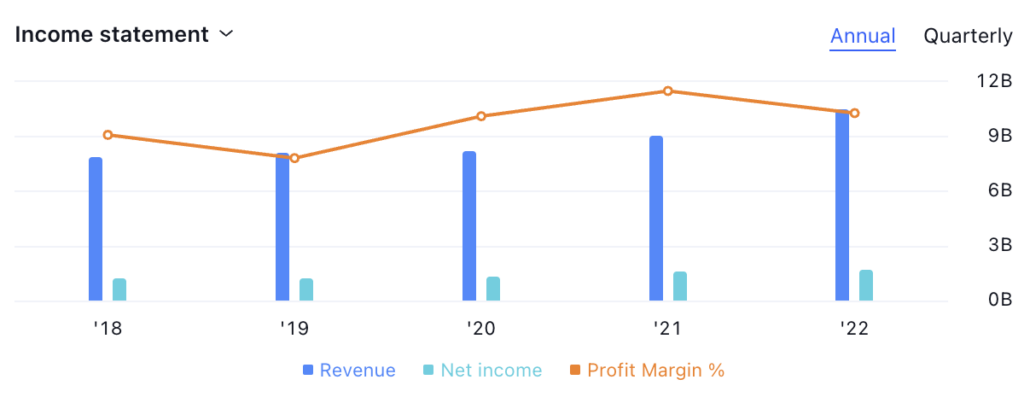
The yearly profit margin percentage of the stock has also declined. The profit margin for the year 2021 was 16.7% and it went straight down to 15% by the end of 2022. This declining profit margin brings down the reputation of the company in the minds of the investors. The investors might be taking less interest in taking the position.
The price of HSY stock peaked at approximately $276.88 in May 2023. Following that, it embarked on a substantial decline and currently showing a downtrend marked by lower lows. This overall structure indicates a negative outlook, suggesting the likelihood of further price decline shortly.
Hershey Co. (HSY) Stock Price Analysis
HSY by writer50_tcr on TradingView.com
Upon examining the MACD indicator, we can note that the MACD line is positioned beneath the signal line, signifying weakness in Hershey’s stock price. Furthermore, the RSI line is situated below the SMA line and has exhibited a reversal from the oversold region. It indicates a negative sentiment surrounding the price of HSY.
Conclusion
In conclusion, the HSY stock is moving in a downtrend direction. The price has shown a negative return in the previous also the indicators are negative for the stock. The stock is showing a weak structure and the price is likely to fall further in the upcoming days.
Technical Levels:
- Support -$182.
- Resistance – $206.
Disclaimer
The views and opinions of the author, or anyone named in this article, are for informational purposes only. They do not offer financial, investment, or other advice. Investing or trading crypto assets involves the risk of financial loss.



