
 Minter
 Bittensor
 Hyperliquid
 NEAR Protocol
 Monero
 Pearl
Pearl Quantus
- The MGM stock price is sustaining above the $34.13 demand level, waiting for the bulls.
- Oscillators are showing positive momentum in the current share price.
MGM Resorts International (NYSE: MGM)) is a global hospital and entertainment company in Nevada, United States. It has a major business in gaming, hospitality, and entertainment activities. The company owns and operates properties in Nevada, New Jersey, Michigan, etc. It also owns casino and no-casino resorts across the world.
The Company’s Financials and Stock Details
The company has been growing competitively within itself for the last few years. In 2022, it reported its annual revenue as $13.08 Billion, which experienced an increase of 38.37% compared to the previous year. Meanwhile, the stock price observed a decline of 25% in the same year.
According to the second quarter, the firm has generated revenue of over $3.00 Billion. It increased by 20.76% as per the year-to-year change. However, it experienced some negative profitability net margins. Consequently, the MGM stock price dropped 16.30% in the next quarter.
After the heavy fall-down of the stock price, it is currently sustaining above the demand area at $34.13. Although, this session can intrigue the buyers to take random positions. For the stockholders, it only paid $0.01 as an annual dividend.
The MGM stock’s total market capitalization stands at $12,151,292,823 with an average trading volume of 21,130,659. It holds the current P/E ratio of 33.62 and has an earnings-per-share of $1.03.
Is MGM Stock Price Forming a Double Bottom Pattern?
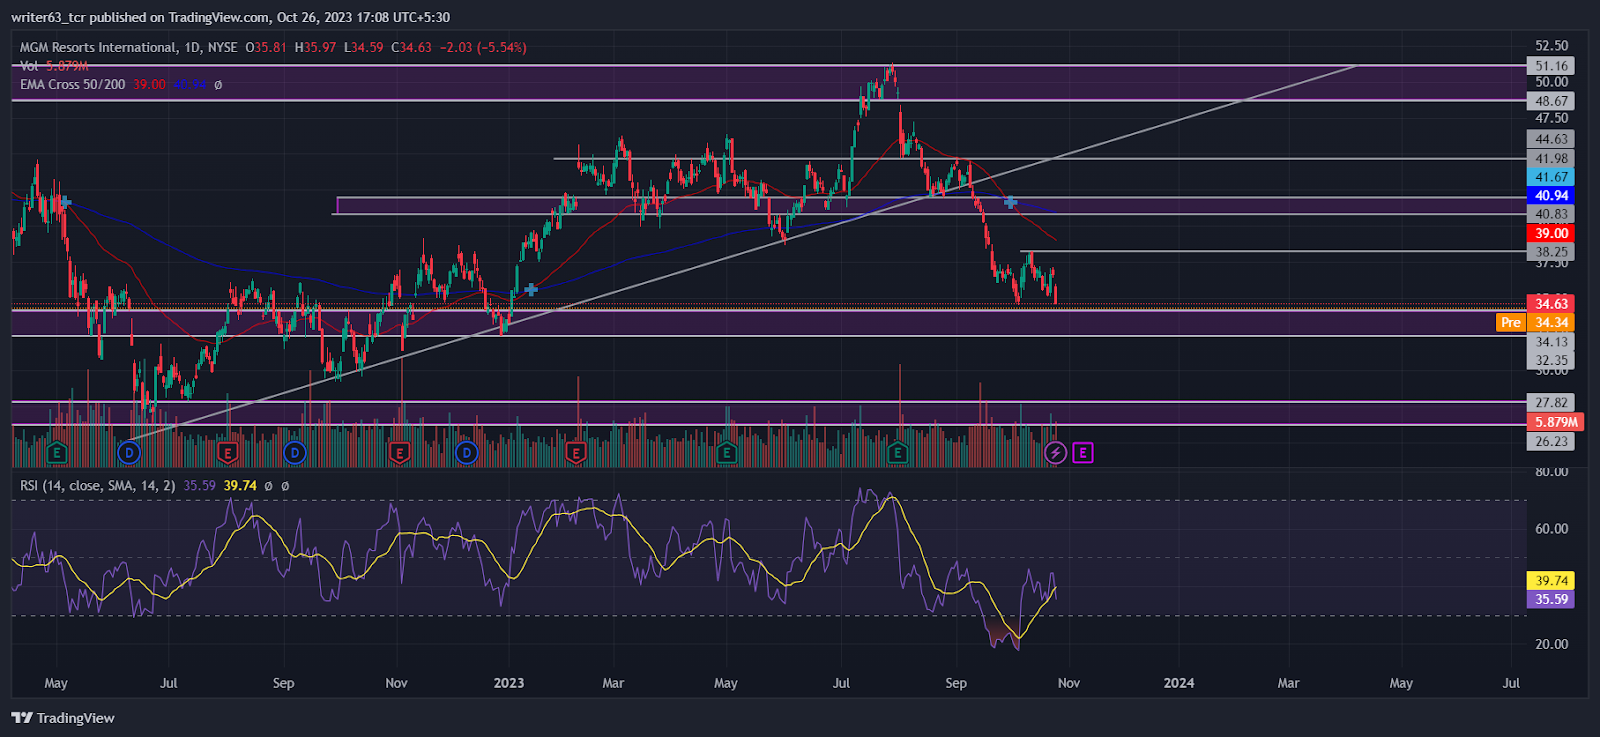
The MGM stock price has recently broken out from a long-lasting uptrend. Consequently, the 50-day EMA made a bearish crossover with the 200-day EMA, leading the price in a strong bearish trend. At present, both EMAs are at $39.00 and $40.94 levels.
After the breakdown of an uptrend, the MGM stock price fell to the $34.13 support level. It faced resistance from the $38.25 immediate resistance level and moved to the previous support level. The price is now trading at the demand zone, which holds the possibility for a potential reversal. However, it formed a strong bearish candle in the last trading session. It reflects the sellers’ presence at that level.
Furthermore, the relative strength index (RSI) is favoring the bulls by showing a strong bullish momentum against the sellers. At present, the RSI is at 35.59, below the signal line.
Conclusion
The MGM stock price has recently given a breakdown from an uptrend. The 50-day and the 200-day EMAs had a bearish crossover. Right Now, the price is trading at the demand level of $34.13 withholding a possibility of a bullish reversal. If it manages to break above the $38.25 immediate resistance, it may retest the breakdown level at $41.98. Suppose it closes below the $32.35 support level, it may fall to the $27.82 level.
Technical Levels
- Resistance levels: $38.25 and $44.63
- Support levels: $32.35 and $26.23
Disclaimer
The views and opinions stated by the author, or any person named in this article, are for informational purposes only. They do not establish financial, investment, or any other advice. Investing in or trading stocks comes with the risk of financial loss.




