
 Minter
 Quack AI
 NEAR Protocol
 Pearl
Pearl Sui
Sui Pons
Pons Quantus
- Exxon Mobil price reversed after hitting the resistance level.
- Exxon Mobil (XOM) quarterly profit margin declined by huge percentages.
- Exxon Corp.’s dividend payout graph has shown a decline.
The XOM stock chart clearly illustrates a strong downward momentum with a lower lows pattern. The price is currency trading at $107.69 with a fall of 0.76% in today’s market session. Over the past six months, XOM has delivered a negative return of 77.39%, indicating a significant selling pressure in the stock.
The quarterly profit margin for XOM has also experienced a decline. Starting at 18.62% in Q3 2022, it fell to 9.7% by the end of Q2 2023, signifying financial challenges for the company.
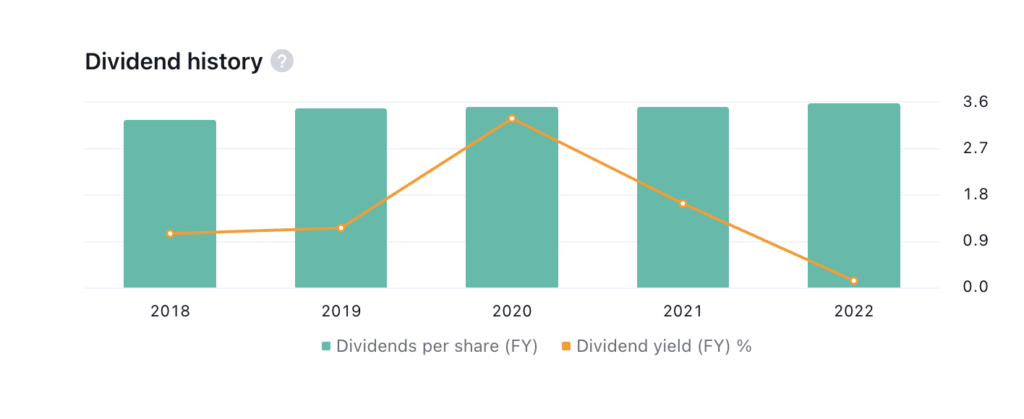
The company pays dividends to its shareholders. The dividends payout of the company has declined from the previous year as shown in the charts. In 2020, the company used to pay dividends of 8.4% and by 2022, it came down to 3.22%. This might be a concerning factor in the minds of retail investors who are looking for other sources of income.
The technical indicator summary for XOM supports a sell signal, with the majority of the 26 indicators favoring a bearish trend, increasing the likelihood of a price decrease.
XOM has been trading within a well-defined parallel channel, fluctuating between $101 and $117 for some time. However, recent price movements have shown a significant reversal from the resistance level, suggesting a potential decline towards the support level. The overall stock structure appears negative.
Exxon Mobil (XOM) Stock Price Analysis
xom by writer50_tcr on TradingView.com
Moreover, both the MACD and signal lines register values below the zero line, leading to the formation of a red histogram on the MACD indicator. This configuration signals the potential for an impending market decline in the upcoming days.
Additionally, Exxon Mobil’s RSI line finds itself positioned beneath the SMA line. This pattern is typically associated with a bearish sentiment, suggesting a probable price decrease.
Conclusion
The Exxon Mobil stock is currently exhibiting signs of downtrend momentum. The price has given a negative return last year. The price has reversed after hitting the resistance level and the indicators are also negative for the stock price. Additionally, the technical indicator summary is giving a weak signal. Hence, the price is expected to decline in the upcoming days.
Technical Levels:
- Support Level – $101.36
- Resistance Level – $117.92
Disclaimer
The views and opinions of the author, or anyone named in this article, are for informational purposes only. They do not offer financial, investment, or other advice. Investing or trading crypto assets involves the risk of financial loss.




