
 Dacity Coin
 Injective
 Starknet
 NEAR Protocol
 Pearl
Pearl Quantus
 Pump.fun
- SLB stock has lost its value by 10% from its all-time high price.
- The Schlumberger N.V. stock has given an all-time return of 7800%.
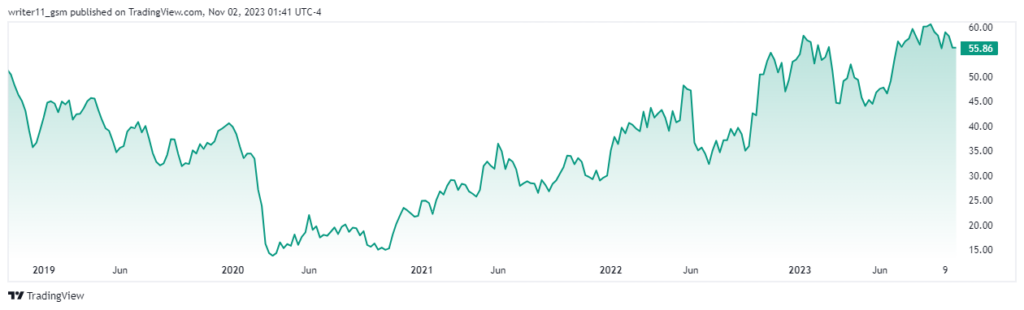
Schlumberger N.V. is an oilfield services company and one of the world’s largest contract drilling companies. The company has its headquarters in Houston and the CEO of the company is Olivier Le Peuch. It has 99K employees and the company was founded in 1926.
Schlumberger N.V. has reliable financial ratios following a debt/equity ratio of 67.81%. The PE ratio of the stock is 19.40 which denotes that the investors are willing to pay higher prices for the stock. The company also has a very good PB ratio of 4.10.
The SLB stock is trading with an average trading volume of 7.79M shares and the current market cap of the company is $79.794B. The beta of the SLB stock is less than 1 resulting in 0.87. This indicates the volatility of the stock compared to the average of the market.
Schlumberger N.V. Stock Performance Analysis
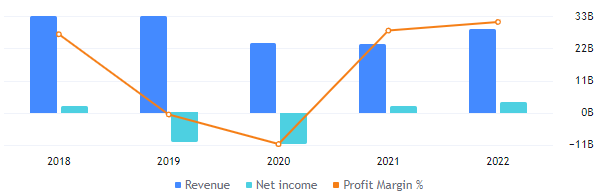
Schlumberger N.V. reported a higher revenue in the year 2022 as compared to the last two years. The reported revenue of the company stands at $28.18B followed by a profit margin of 12.21%. The debt for the company has also declined by $2.27B in 2022.
SLB Stock Taking Support At Crucial Level, What Can Happen Next?
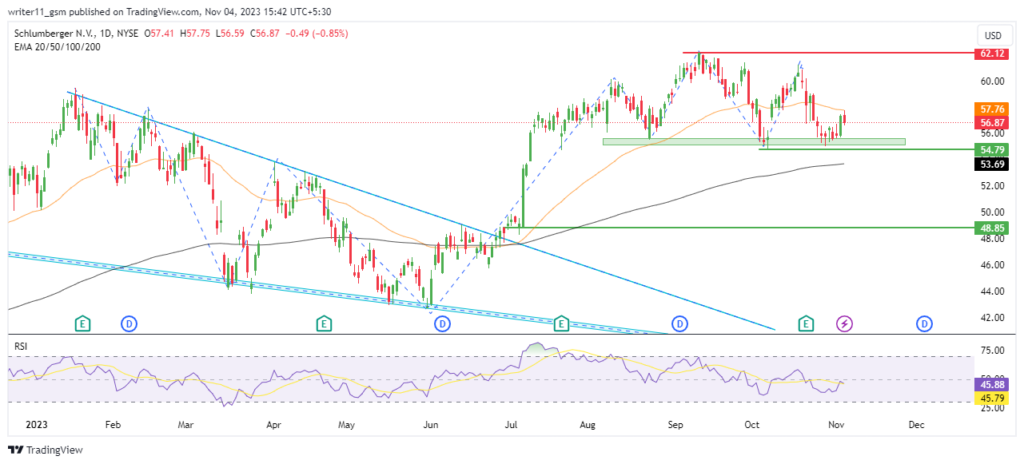
The SLB stock was trading inside a falling wedge pattern and once the stock price broke above it, it resulted in an advance of 27% and started to take resistance at the higher levels.
After advancing to certain higher levels, the SLB stock took resistance at its all-time high price of $62.12. The stock price lost its momentum since then and the price started to form lower low patterns. The SLB stock is currently taking support at a crucial level and the price action is showing sellers dominance.
The SLB stock is trading in a golden cross followed by 50-day and the 200-day EMA. Despite this, the stock price of the SLB has declined below the 50-day EMA indicating the initial dominance of the sellers in the stock.
The RSI on the SLB stock chart is also giving a sell signal as it is trading below the 50-level. The value of the RSI has also declined below the 14-day SMA line trading at a level of 39.94.
SLB/NYSE Stock Chart by TradingView
Conclusion
Schlumberger N.V. has reliable financials and the stock price is currently taking a pause after a huge advance in price. The SLB stock price may also lead to a retracement phase resulting in a declining trend. Based on the most recent price action, if the SLB stock price breaks below the level of $54.70, it might lead to further lower levels in the upcoming days.
Technical Levels
- Support levels- $48.80 and $54.80
- Resistance levels- $62.00 and $68.00
Disclaimer
The information provided in this article, including the views and opinions expressed by the author or any individuals mentioned, is intended for informational purposes only. It is important to note that the article does not provide financial or investment advice. Investing or trading in cryptocurrency assets carries inherent risks and can result in financial loss.




