
 Pearl
Pearl Starknet
 Quantus
 Sui
Sui NEAR Protocol
 Pudgy Penguins
 Lighter
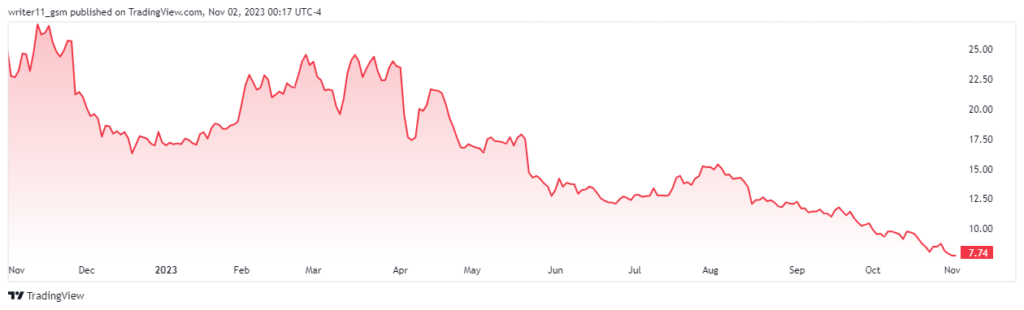
- In the last year, the ZIM stock has lost its value by more than 65%.
- The company yielded a dividend of 160.27% in 2022.
ZIM Integrated Shipping Services Ltd. is an American marine shipping company. The current CEO of the company is Eliyahu Glickman and the company was founded in 1945. The company has 6.53K employees and has its headquarters in Haifa. The ZIM Integrated Shipping Services Ltd. has a market cap of $930.225M and a huge payout ratio of 71.58%. The company paid a total of $27.55 as a dividend the previous year. In the year 2021, the company paid a dividend of $2.50 has suddenly spiked in 2022.
The PE ratio for the ZIM stock is 0.72, which is a very low ratio and suggests that the stock is highly undervalued. The basic EPS for the Zim Integrated Shipping Services Ltd. share is 10.85 USD which represents that the company is profitable. It is making a profit of $10.85 on each share. The last trading session’s traded volume for the ZIM stock is 1.564M followed by an average trading volume of 2.39M in the last ten days.
Zim Integrated Shipping Services Ltd. Stock Performance Analysis
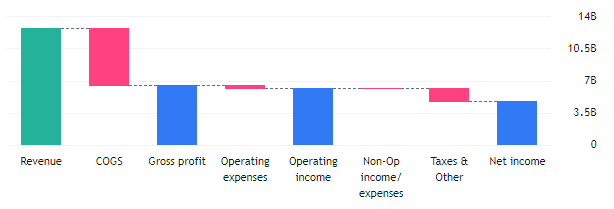
The Zim Integrated Shipping Services Ltd. revenue is following an uptrend by consistently advancing every year. The reported revenue of the company for the year 2022 is $12.56B. This has resulted in a profit margin of 36.77% following a reported net income of $4.62B. Further, the company incurred a COGS of $6.161B throughout the year.
What Technical Charts Of ZIM Stock Are Doing?
On the broader charts the ZIM stock has made a designed pattern where the stock price advanced to a certain level and then again declined to the all-time lows. The ZIM stock opened with a trading price of $11.50 and hit a high of $91.23. Further after hitting its all-time high price, the stock declined below the all-time lows and made new lows on the charts.
The ZIM stock is currently following a downtrend and is declining to lower lows. The stock price is forming lower low swing patterns on the charts and witnessing selling pressure for a long time. On the daily timeframe, the EMAs are trading in a death cross following a strong downtrend. The price is consistently declining with the decline in the value of the 50-day and the 200-day EMA. The RSI for the ZIM stock is acting bearish trading below the oversold zones. The RSI is currently trading at a level of 29.04 declining below the 14-day SMA.
Conclusion
The company has a very good dividend payout which can be a center of attraction for investors who are looking for passive income. Despite this, the technicals of the stock are extremely negative on the charts and there is no sign of buying in the ZIM stock. Thus, the ZIM stock price might continue to decline to lower levels and show further decline in price in the upcoming days.
Technical Levels
- Support levels- $3.00 and $5.00
- Resistance levels- $15.50 and $22.00
Disclaimer
The information provided in this article, including the views and opinions expressed by the author or any individuals mentioned, is intended for informational purposes only. It is important to note that the article does not provide financial or investment advice. Investing or trading in cryptocurrency assets carries inherent risks and can result in financial loss.




