
 Quack AI
 NEAR Protocol
 Lighter
 Bitway
 Pearl
Pearl Quantus
 Sui
Sui
- Royal Caribbean Cruises Ltd. has shown a huge increase in its profit margin percentage.
- The Royal Caribbean Cruises Ltd. stock price has shown an increase of 100% in the previous year.
- The target price for RCL stock for the upcoming year, as per the analyst rating, is $119.4.
The target price for RCL stock for the upcoming year, going by the technical analyst rating, is $119.94, which reflects a 29.8% rise from the current price.
The technical indicator summary from TradingView also suggests a ‘buy’ signal for RCL stock, supported by the moving averages summary.
The RCL stock is currently trading at $92.3, with a rise of 4.5% in today’s market session.
The stock price has shown an impressive rise of 100% in the previous year and in the last week, it jumped by around 10%. This is a huge return achieved by the company and this will become a positive factor in the minds of investors.
The recent price pattern for Royal Caribbean Cruises Ltd. Inc. (RCL) stock indicates a consistent series of higher highs, underscoring a strong market sentiment and a shift in the stock’s price trajectory.
The annual profit margin percentage for the company has improved compared to the previous year. In 2021, the profit margin percentage was -343%, and it increased to -24% in 2022. Furthermore, the net income has risen, bringing positive news for the stock and signaling an improvement in the company’s financial performance.
RCL stock reached a peak of $112.95 in July 2023, after which the price experienced a decline of approximately -31%. However, it found support at $78, and now the price is moving upward within a channel pattern.
The overall stock structure presents favorable indications, with the price expected to rise in the coming days.
Royal Caribbean Cruises Ltd. (RCL) Technical Analysis
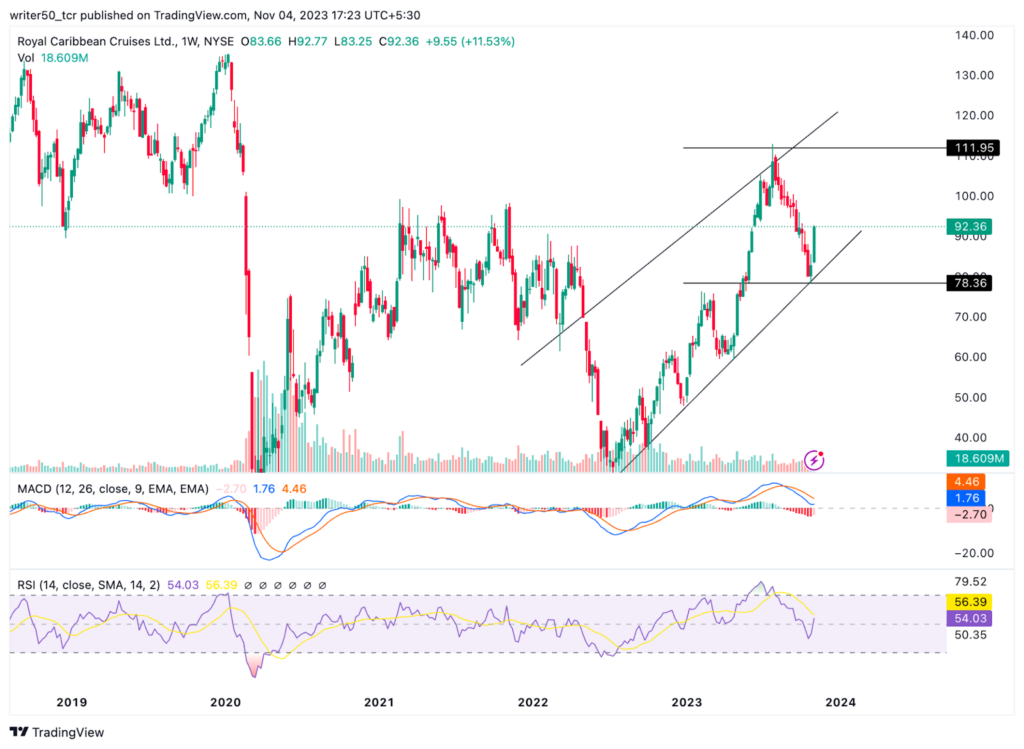
The RSI line for the RCL stock is above the 50 level which is considered as the positive region. Also, the RSI line is showing signs of formation of positive crossover. Hence, if the RSI line moves above SMA line the probability for the price rise increases.
On the other hand, the MACD line is currently situated above the signal line, accompanied by the formation of a green histogram on the RCL stock chart. When taken together, these technical indicators give a bullish outlook for the stock, increasing the potential for a future price rise.
NYSE : RCL Stock Chart By TradingView
Conclusion
In conclusion, the price of RCL stock is moving in an uptrend inside the rising channel pattern. Stock price has reversed after hitting the support level. The overall structure of the stock is positive and the price has shown an impressive return in the previous year. Hence, the price is expected to rise further and hit the fresh swing high.
Technical Levels
· Support Level: $78 and $65
· Resistance Level: $111 and $120
Disclaimer
The views and opinions of the author, or anyone named in this article, are for informational purposes only. They do not offer financial, investment, or other advice. Investing or trading crypto assets involves the risk of financial loss.




