
 Altai the Tiger
 IGNITION
 streamoors
 Sword Inu
 NEAR Protocol
 Injective
 Quantus
- Hive Coin has surged by over 13% in a month.
- The token’s price has recently escaped from the months-long consolidation.
- The current market price of the Hive Blockchain Token is $0.3549.
The HIVE Coin price has been a performer in its initial trading phase and the coin price has surged by over 2600% from the low in 2021. However, as the year 2022 progressed and came to an end, the coin price started to decline. The coin’s price has started to fall and corrected sharply by over 91% till now.
The downtrend was halted in December 2022 and the coin price has started to rise. The Bulls have tried their best to change the structure of the chart and turned it from bearish to bullish. However, the buyers soon lost their momentum and gave a chance to sellers. The sellers have shown an aggressive stance on the coin and slid it down towards the Yearly Low level of $0.2508.
The Hive Coin in the current trading session is witnessing some pressure from the buyers and is trading with a decline of 0.0057 or 1.58%. This token’s total volume traded on the Binance exchange in the current session is 512.76K. Its current market capital is $179 million
A Synopsis Of the HIVE Coin Chart
The Hive Coin price has recently given a breakout from the descending triangle pattern and has reacted positively after that. After the breakout, the coin price retested the pattern and surged back, this confirms the authenticity of the breakout. The Coin price has surged over 14% in a month, which shows that some serious buying has happened at the lower level.
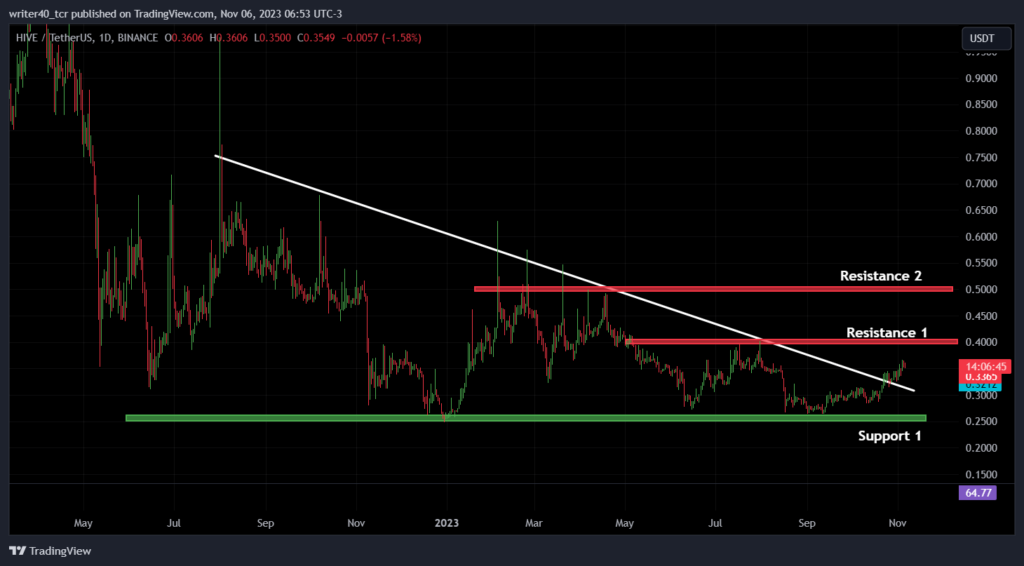
The Hive Coin price is inching closer to the crucial resistance level of $0.4000, which is also a previous swing high of the coin price. The Buyers have successfully defended the $0.2628 level. It will provide the support in future as well. The other resistance level is present near the level of $0.4990.
A Quick Glance on the EMA and RSI Indicators
The Hive Coin price is currently trading above the 50-day and 200-day Exponential Moving Average and recently regained control of that. The slope of the 50-day EMA is curving upward. It indicates that the coin price is strong and can soon witness a golden crossover on the chart.
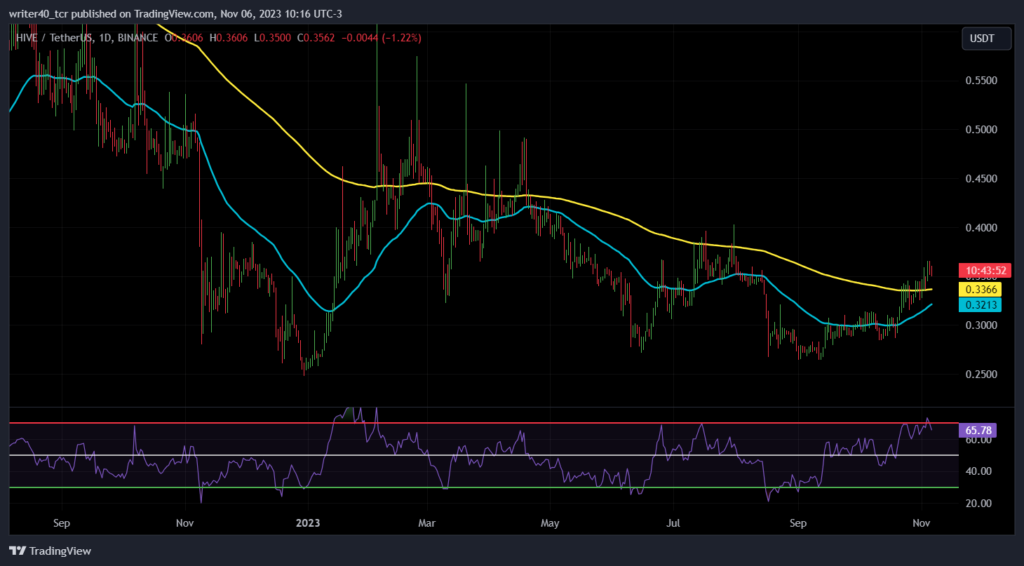
The Relative Strength Index is curving at 65.78, which shows that the momentum is favoring the bulls and the coin price can reach a much higher level ahead.
Conclusion
Both Price action and Indicators favouring the bullish sentiment and the coin price can try to go higher ahead. However, in recent times the Hive coin price has been forming some weak candles on the daily chart. It means the buyers are struggling to lift the price.
Technical Level
- Resistance – $0.4000 and $0.4900
- Support – $0.2628
Disclaimer
The views and opinions stated by the author, or any people named in this article, are for informational purposes only. They do not establish financial, investment, or other advice. Investing in or trading crypto assets comes with a risk of financial loss.




