
 Minter
 Quack AI
 NEAR Protocol
 Pearl
Pearl Sui
Sui Pons
Pons Quantus
- BRCC stock price recovered approx. 13.45% in November 2023.
- The 50-day EMA acting as a hurdle in BRC stock.
- BRC Inc. reported the Q3 Earnings on November 9, 2023.
BRCC stock price took support near $2.50 and showed a decent bounce from the 52-week low. It recovered approx. 13.45% in November and buyers are trying their best to push the price above the 50-day EMA.
The short-term rally in the BRC stock was triggered after the release of Q3 earnings. Bulls are giving a follow-up momentum showing that recovery in the shares may continue for some more time.
If BRCC stock price climbs above the 50-day EMA and sustains, then the short-term trend may reverse upward and the price may rally to $4.00.
The chart pattern of the BRC shares is bearish. So, it will be difficult to interpret whether the pullback rally will hold the higher levels or not.
The stock will sustain the higher levels only when genuine buying takes place. Else, the price will lack momentum and erode the gains.
BRC Inc. released the quarterly earnings on November 9, 2023. It reported an EPS of $0.05 vs -$0.01 estimate. The reported revenue is $100.536 Million vs $106.597 Million of estimates.
The company failed to beat the EPS as well as revenue estimates. Despite that, the stock price reacted positively and surged 7% after earnings.
Will BRCC Stock Price Reach $5 by December End?
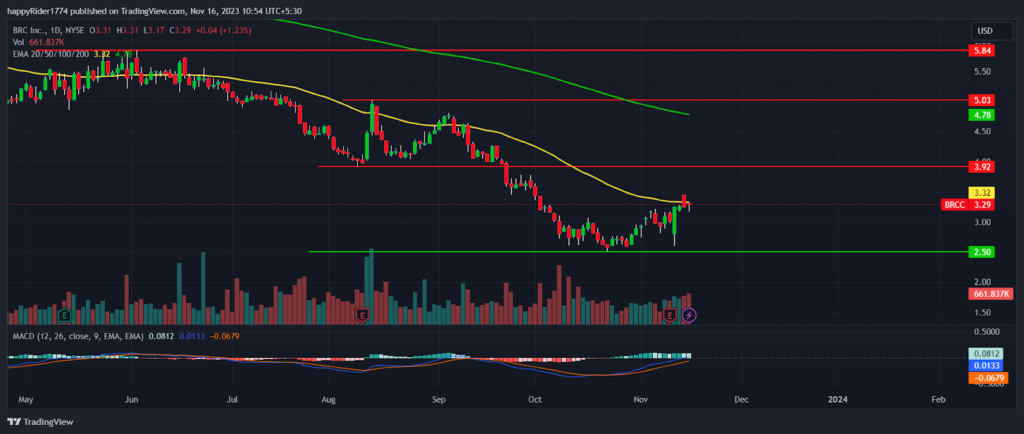
BRCC stock is in the recovery mode and buyers succeeded in breaking out of the $3.00 hurdle. To regain the confidence of long-term investors, the stock needs to break the pattern of lower-low swings.
On the higher side, $4.00 will act as an immediate huddle for the bulls. If the overall market sentiment remains positive, then the probability of a $4.00 breakout will substantially increase.
On the other hand, if the BRCC stock price faces rejection, then it may reverse down and spend time in a range. The analysis suggests that until the stock breaks the $4.00 hurdle, the possibility of reaching $5.00 by the December end remains low.
BRC Stock Price Formed a Bullish Hammer Candle
BRC stock price formed a bullish hammer candle on the weekly time frame chart. Buyers are active but need to sustain the price above the 50-day EMA to show their dominance.
The MACD curve slopes upward and near the zero line. The histogram forming a rising bar shows the strength in the upmove.
The supertrend also favors the bulls and shows mild bullishness. Furthermore, the RSI at 57 sloping upward indicates more scope for upside is open.
Conclusion
BRCC stock rose 13.45% in November and showed initial signs of a short-term trend reversal. However, the confirmation is still awaited.
The analysis suggests bulls will come back after a breakout from the $4.00 level. Till then, the upmove is temporary and may face rejection.
Technical Levels
- Resistance levels: $3.92 and $4.50
- Support levels: $2.80 and $2.50
Disclaimer
The views and opinions stated by the author, or any people named in this article, are for informational purposes only. They do not establish financial, investment, or other advice. Investing in or trading crypto assets comes with a risk of financial loss.




