
 Quantus
 Pearl
Pearl Quack AI
 Starknet
 NEAR Protocol
 Zcash
Zcash Aerodrome Finance
- Pfizer Inc. declined by over 1.59% in today’s market session.
- PFE company’s profit margin percentage is decreasing, indicating a weak financial condition for the company.
- The PFE is recommended as a strong sell by the TradingView technical indicator summary tool.
The PFE stock is currently indicating a downtrend in the weekly timeframe, marked by lower lows and a breakout from the support level. The profit margin percentage of the PFE stock witnessed a decline. The profit margin for the Q1 2023 was 30.31% and it fell upto Q1 2023 -18% by the end of Q3. This decrease in profit margin is a concerning factor for the stock.
The technical indicator summary on TradingView strongly signals a bearish trend for PFE stock. Out of the 26 indicators, 16 suggest a sell signal, while none recommend a buy signal, indicating a bearish sentiment. Additionally, the moving averages recommend a strong sell signal.
After reaching a peak of $61.71 in December 2021, the stock experienced a substantial decline of more than 50%, finding support at the $33 level. However, the stock has recently broken below this support level, indicating a downward movement.
The overall structure of the stock points towards a negative outlook, increasing the likelihood of a price decline in the upcoming days. The stock exhibited a negative return of more than 38% last year, reflecting a challenging performance by the company.
Pfizer Inc. (PFE) Stock Price Analysis
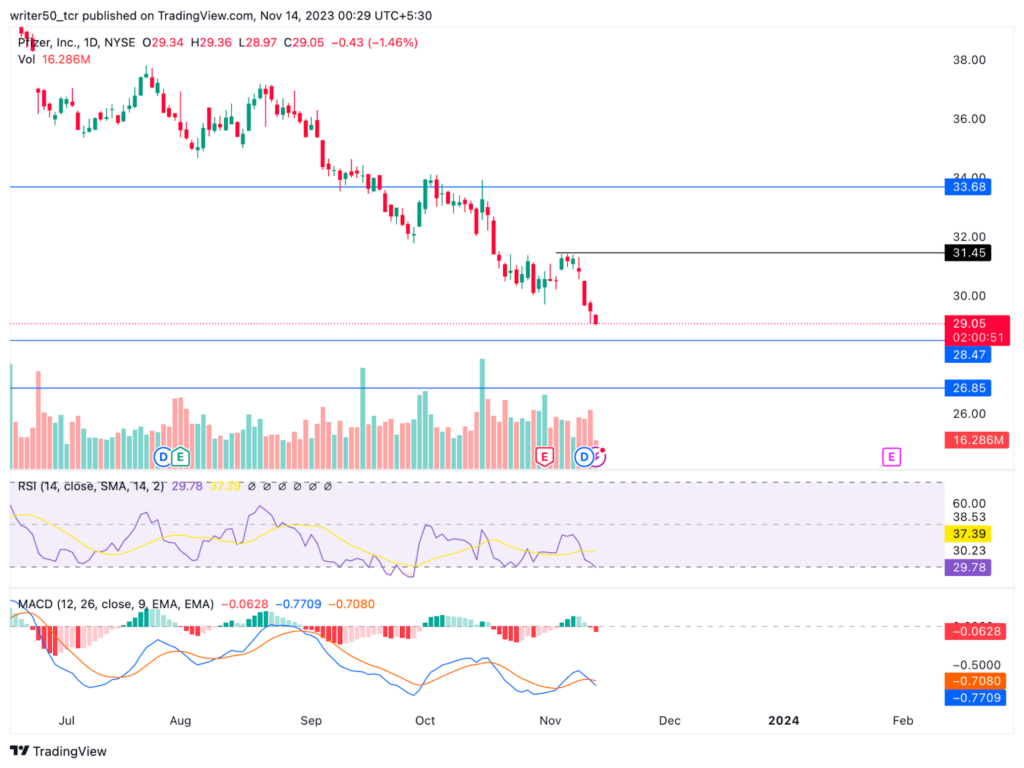
The MACD line for PFE stock is currently below the signal line, accompanied by the formation of a red histogram, indicating a weak signal. This setup implies the possibility of a price decline in the upcoming days.
Furthermore, the RSI line for PFE stock is positioned at 29, closely following the SMA line at 37. The RSI line is below the SMA line, experiencing a negative crossover. This signals an anticipation of a decline in the stock price in the upcoming days.
Conclusion
According to the analysis, the ongoing trend of the PFE stock indicates a downward trajectory. The price has given a breakout from the resistance level. The indicators are pessimistic and the overall trend signals a decrease in the stock price in the upcoming days.
Technical Levels
- Support Levels– $28 and $26
- Resistance Levels- $31 and $33
Disclaimer
The views and opinions of the author or anyone in this article are for informational purposes only. They do not offer financial, investment, or other advice. Investing or trading crypto assets involves the risk of financial loss.




