
 Dacity Coin
 Injective
 Solana
 Celestia
 Starknet
 Quantus
 NEAR Protocol
- The 52-week low of the Paramount Global Srock Price is $10.51.
- BofA Securities has initiated an “underperform” rating on the Para Stock.
- The Company released its earnings report on November 3, 2023.
In the previous trading session, the PARA stock price has declined by more than 7%. The stock has registered a good trading volume, which signifies that the fall was serious and some investors have exited their positions from it. However, the stock has shown some recovery in the last phase of the trading hours and formed a bearish candle on the daily chart.
Paramount released its earnings report on 3 November 2023. It has reported a surprise of -0.06% in the revenue aspect, as the revenue generated by the company is $7.13 Billion. The Zacks Consensus estimated the revenue to be $7.14 Billion. However, the EPS has beat the estimate by a huge margin as it has reported a surprise of 275%. The market estimation for the EPS was $0.08 and the company has reported $0.30.
BofA Securities downgraded the rating of the PARA stock from “BUY” to “UNDERPERFORM”. However, the rating firm has sharply cut down the target price of the stock from $32 to $9. The stock price has reacted negatively to the news and it has fallen by about 14% in the last three days.
Is PARA Stock a Good Buy At The Current Levels?
The stock price is following a downward-sloping trendline and has reacted sharply from that. The price has faced resistance for the fourth time, which indicates that the sellers are still present near the trendline. If we examine the financial tally of the company, it has done well in the past and is lagging for the first time.
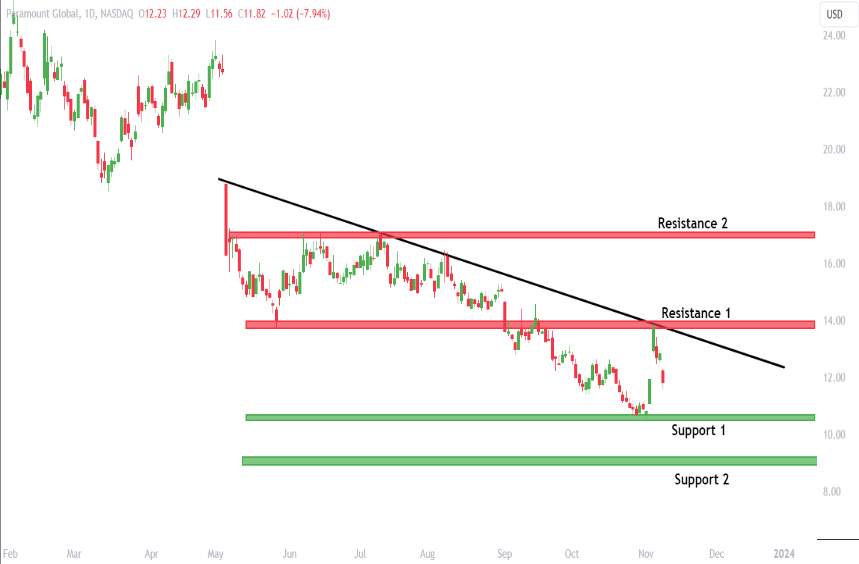
The Paramount Global stock price has fallen after it faced rejection from the trendline and resistance zone together. The resistance level was present at the level of $13.85 and the other resistance is present near the level of $16.96. The stock price is inching closer to the 52-week low level, which is also a crucial support level for the price. The other support for the price is present near the level of $9.20.
What Are The Indicators Indicating About the Stock Price?
The stock price is trading below the 50-day and 200-day Exponential Moving Average. Recently, Paramount Global stock price has closed above the 50-day EMA, but soon it closed below the 50-day. It indicates that the stock price has failed to provide the necessary follow-up.
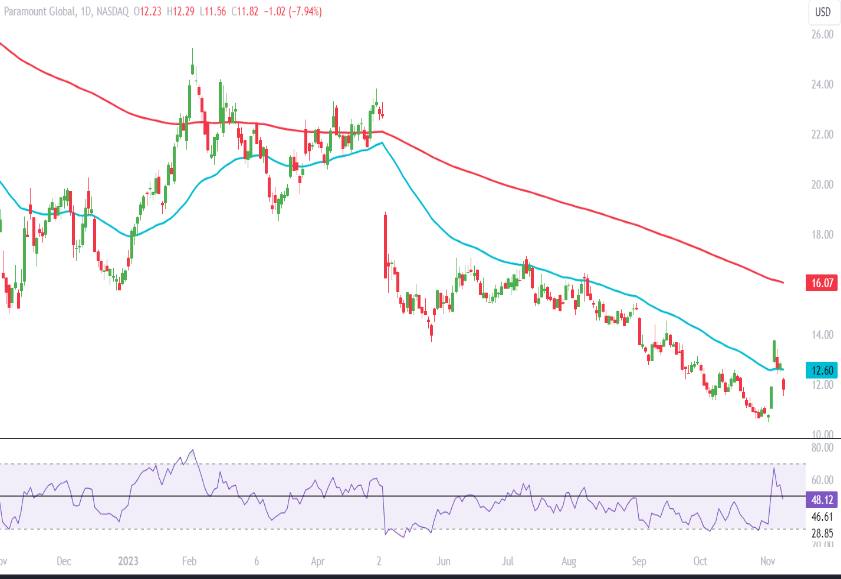
The relative strength index (RSI) is curving at the 48.12 level and favoring the bears. The slope of the RSI is downward, which indicates that the bears are slowly gaining momentum in the stock.
Conclusion
The Para Company has posted a good result this quarter but overall the financial tally of the company has become Dubious. Several rating firms have rated negative on the stock, which can create some more selling pressure in the coming times.
Technical Level
Resistance – $13.85 and $16.96
Support – $10.51 and $9.20
Disclaimer
The views and opinions stated by the author, or any people named in this article, are for informational purposes only. They do not establish financial, investment, or other advice. Investing in or trading crypto assets comes with a risk of financial loss.




