
 streamoors
 Injective
 Pudgy Penguins
 Celestia
 Pearl
Pearl Sui
Sui Bitcoin
- The ZEC crypto hit its all-time high price in the same year it was launched.
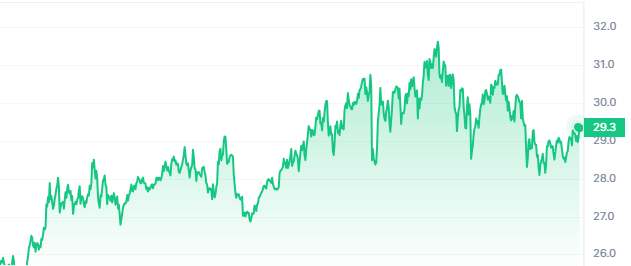
- Over the last 30 days, the Zcash price has advanced by 15%.
The ZEC crypto is mainly designed to secure the address and identity of the user who initiates the transaction. It uses zero-knowledge proof technology which is also known as zk-SNARK. It follows proof-of-work algorithm and utilizes the Equihash consensus mechanism for securing its network.
The derivative trading volume of the ZCash crypto has declined by 12.86% in the last 24 hours. This further results in a flat open interest change resulting in $16.77M. The long/short ratio of the crypto is 1.006 resulting in a higher short liquidation of 2.61K. Following the derivatives data, it can be clearly seen that the buyers are winning over the crypto price.
The market cap of the Zcash has advanced by 1.97% in the last 24 hours following the advance in crypto price. Further the trading volume of the crypto has declined by 14.73% resulting in $51.94M.
Token Distribution Analysis
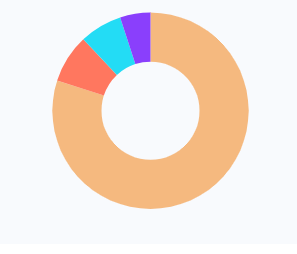
The Zcash crypto has a max total supply of 21.0M ZEC which is similar to the supply of Bitcoin. The current circulating supply of the crypto is 16.238M ZEC and 80% of the tokens are distributed as mining rewards. This further has resulted in a fully diluted market cap of $620.399M.
Price Vs Volatility
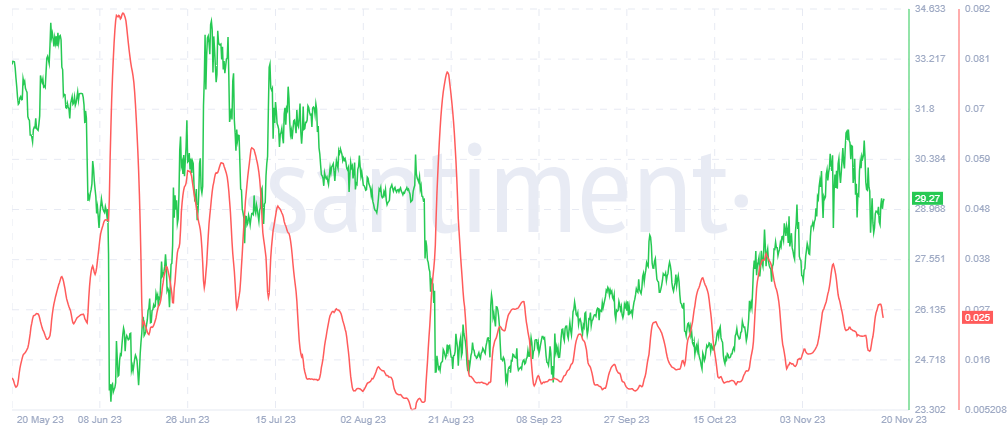
As per the recent charts, the volatility of the ZEC crypto has declined with the advance in the price. This behavior of volatility represents that the crypto price is becoming stable with time.
ZEC Crypto Price Might Hit The Highs Of February 2023
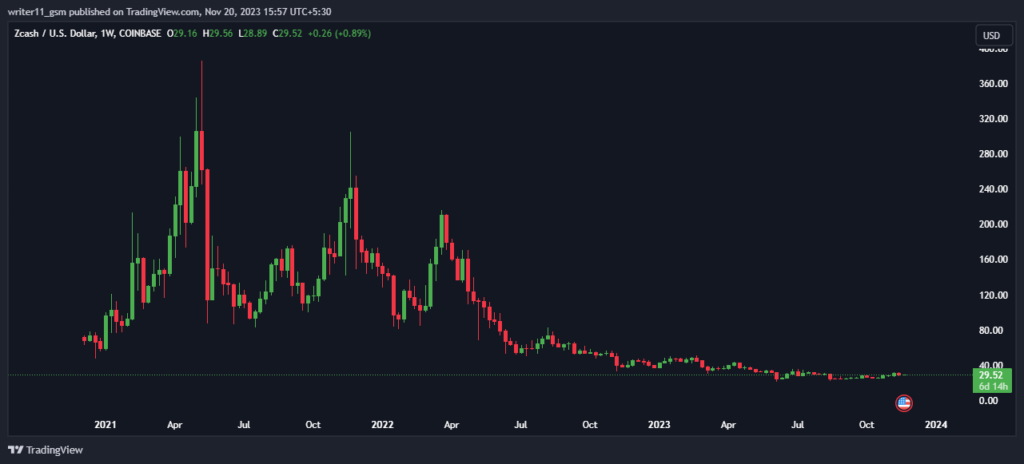
On the weekly charts, the ZEC crypto price has lost its value by more than 92% from its all-time high levels. It shows how dominant and powerful sellers have been in this token for a long time.
On the daily chart of the ZEC/USD, the price was trading inside the falling wedge pattern. It has broken out above the pattern recently, indicating signs of bullishness. Based on the current behavior of the crypto price, it might continue to advance to higher levels.
The EMA and the RSI on the charts are giving a buy signal. The technical indicators are giving a buy signal on the daily timeframe chart.
ZEC/USD Chart by TradingView.com
Conclusion
The ZEC crypto is witnessing bullish price action on the daily charts. Despite a strong downtrend in the larger timeframe, the crypto might advance to higher levels in the upcoming days. It is because the technical indicators are giving a buy signal on the daily timeframe.
Technical Levels
- Support levels- $22.00 and $28.00
- Resistance levels- $34.00 and $43.20
Disclaimer
The views and opinions stated by the author or any other person named in this article, are for informational purposes only and do not constitute financial, investment, or other advice. Investing in or trading crypto or stocks comes with a risk of financial loss.




