
 Quack AI
 Quant
Quant Pudgy Penguins
 Ondo
Ondo NEAR Protocol
 Starknet
 Bittensor
- The ZEC price is trading at $25.6 observing an increase of 3.33% in the intraday session.
- The price has formed a descending triangle pattern in a daily timeframe.
- It is trading below the 50-day and 200-day EMAs.
ZEC marked its yearly high of $50 in the third week of February. Since then, the price has been bearish and declined almost by 50% till now. The token gave its last bullish move in June when the price took support from the $24 level and gave an upward move of almost 44%. Post this move, the price started to move bearish again and ended up making a descending triangle pattern.
It marked an all-time high of $5941.80 on October 29, 2016. The token is down by 99.40% from the all-time high. During this high, the market capitalization of the token was at 3.69 Billion.
Currently, the circulating supply of the token is 16.32 Million ZEC, with a market capitalization of $418.80 Million. The trading volume of the token has surged by 4% in the last 24 hours.
Sentiment Analysis
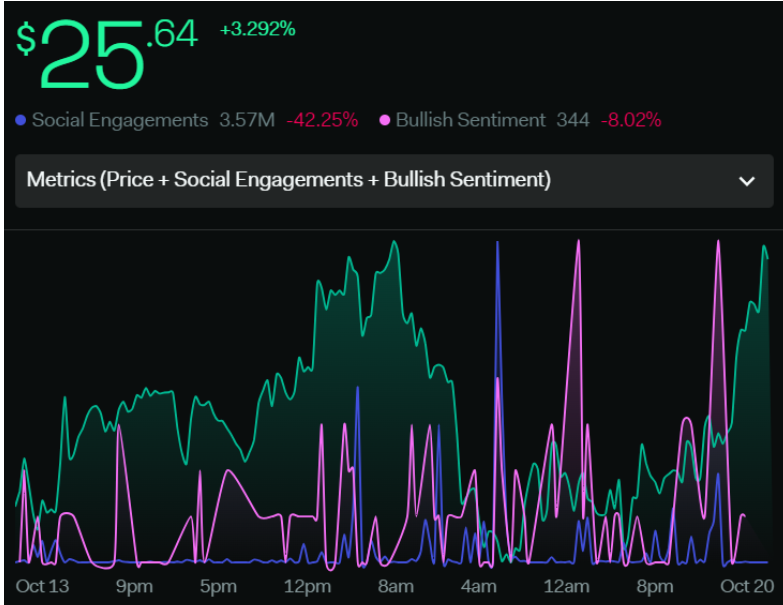
The weekly volume of the token dropped by 4% resulting in a decrease of the bullish sentiment metrics by 8.02%. The social engagement metric of the token shows the losing interest of investors and the inactivity of the social community. Overall analysis indicates a bearish price action.
Technical Analysis Of The ZEC Coin (Daily-1D)
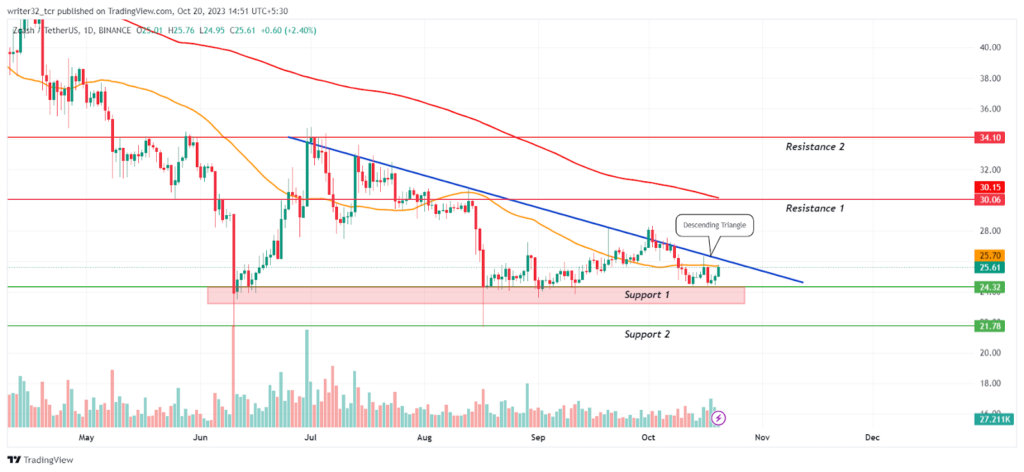
The ZEC coin price has to give a break from the descending triangle to reach $30.It is trading at the 50-day EMA and below the 200-day EMA. It also has to cross above the 50-day EMA and maintain its move above to be in favor of the bulls. If the price gets rejected from the top of the descending triangle, then the price can again fall to the support level of $24.
However, If the price breaks the resistance of $30 with a sizable amount of volume, then the price can reach the levels of $34 to $38. Bulls have to be careful of the bearish investors present on the resistance level who will push the price down during the bullish move.
Indicators On The Price Of ZEC Coin
Relative Strength Index (RSI)
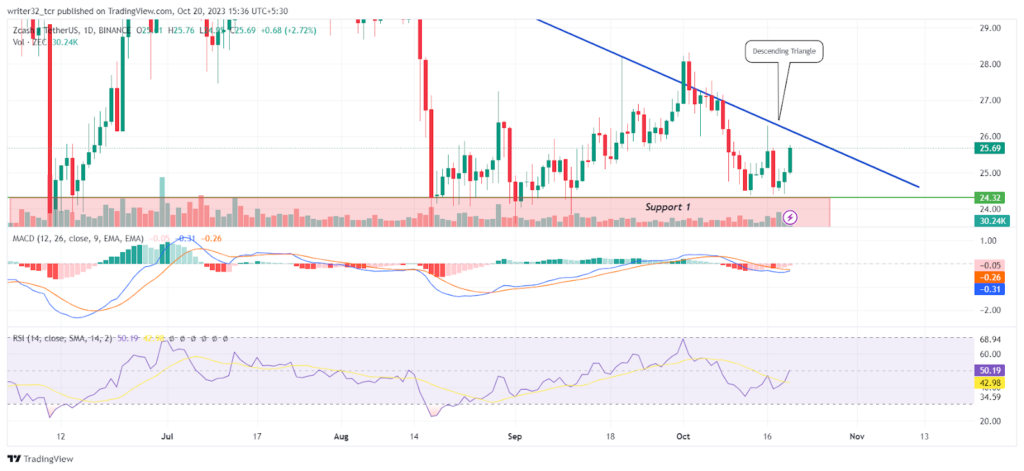
The RSI line is moving at 50.19 points and the SMA 14 at 48.47 points and above the neutral level. RSI is moving upwards from the SMA 14 giving the price an upward movement.
Moving Average Convergence/Divergence (MACD)
The fast blue line moving average will soon cross above the red slow line moving average, which will be a bullish cross for the price. There will be increased volume inflow after the cross.
ZEC LIVE CHART
Conclusion
The overall analysis of the ZEC coin suggests an upward move till the price reaches on top of the descending triangle. If the price breaks from the top and sustains, it can get bullish further. If not, the price can again fall down to the support level of $23 to $24.
Technical Levels
- Support Level: $23 to $24 and $21.7
- Resistance Level: $30 and $34
Disclaimer:
The views and opinions stated by the author, or any people named in this article, are for informational purposes only and do not establish financial, investment, or other advice. Investing in or trading crypto assets comes with a risk of financial loss.




