
 Minter
 Bittensor
 Hyperliquid
 NEAR Protocol
 Monero
 Pearl
Pearl Quantus
- FXS coin price is showing an advanced over 27% in the previous year.
- The open interest of the FXS coin has increased by 1.32% in the last 24 hours.
Frax Share (FXS) stands as a non-stable, utility token within the Frax protocol, crafted to wield governance rights and play a pivotal role in the system’s utility.
Prioritizing a governance-minimized strategy, FXS empowers its community to influence substantial decisions concerning the protocol.
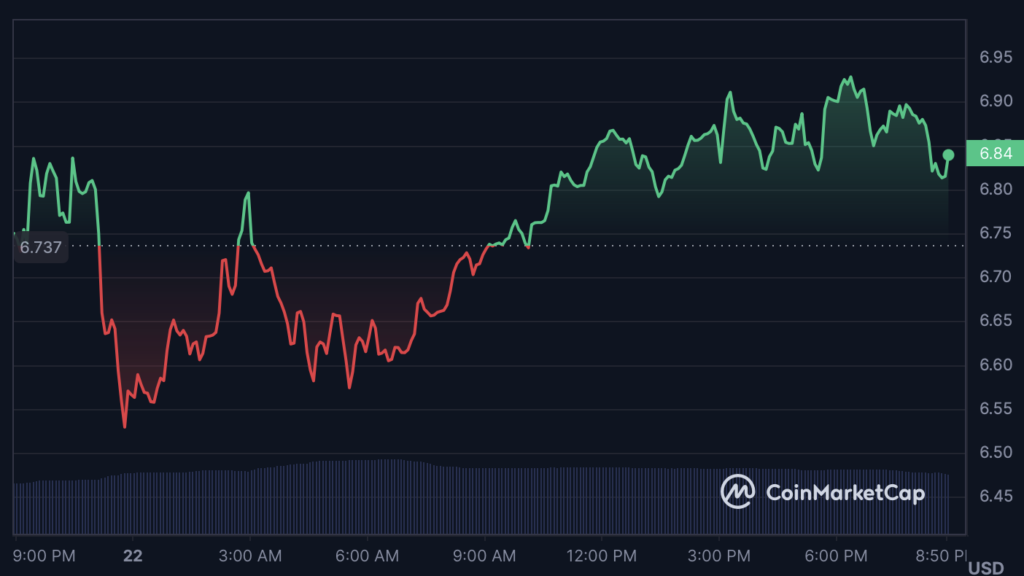
Financials of FXS Coin
FXS coin is currently trading at $6.89, with an advance of 5.2% in the last 24 hours. The total number of FXS mined is 73,855,992 FXS.
The FXS coin is witnessing an advance of 50% since the last year. The positive market returns symbolize that buyers are actively participating in the market.
The total trading volume of FXS is $47 Million in the last 24 hours. The volume of the coin is showing a rise of 33.59%, showing the dominance of the buyers.
The FXS is ranked as #94 in the top global coins, with volume/market cap ratio of 0.09.
Frax Share Technical Analysis
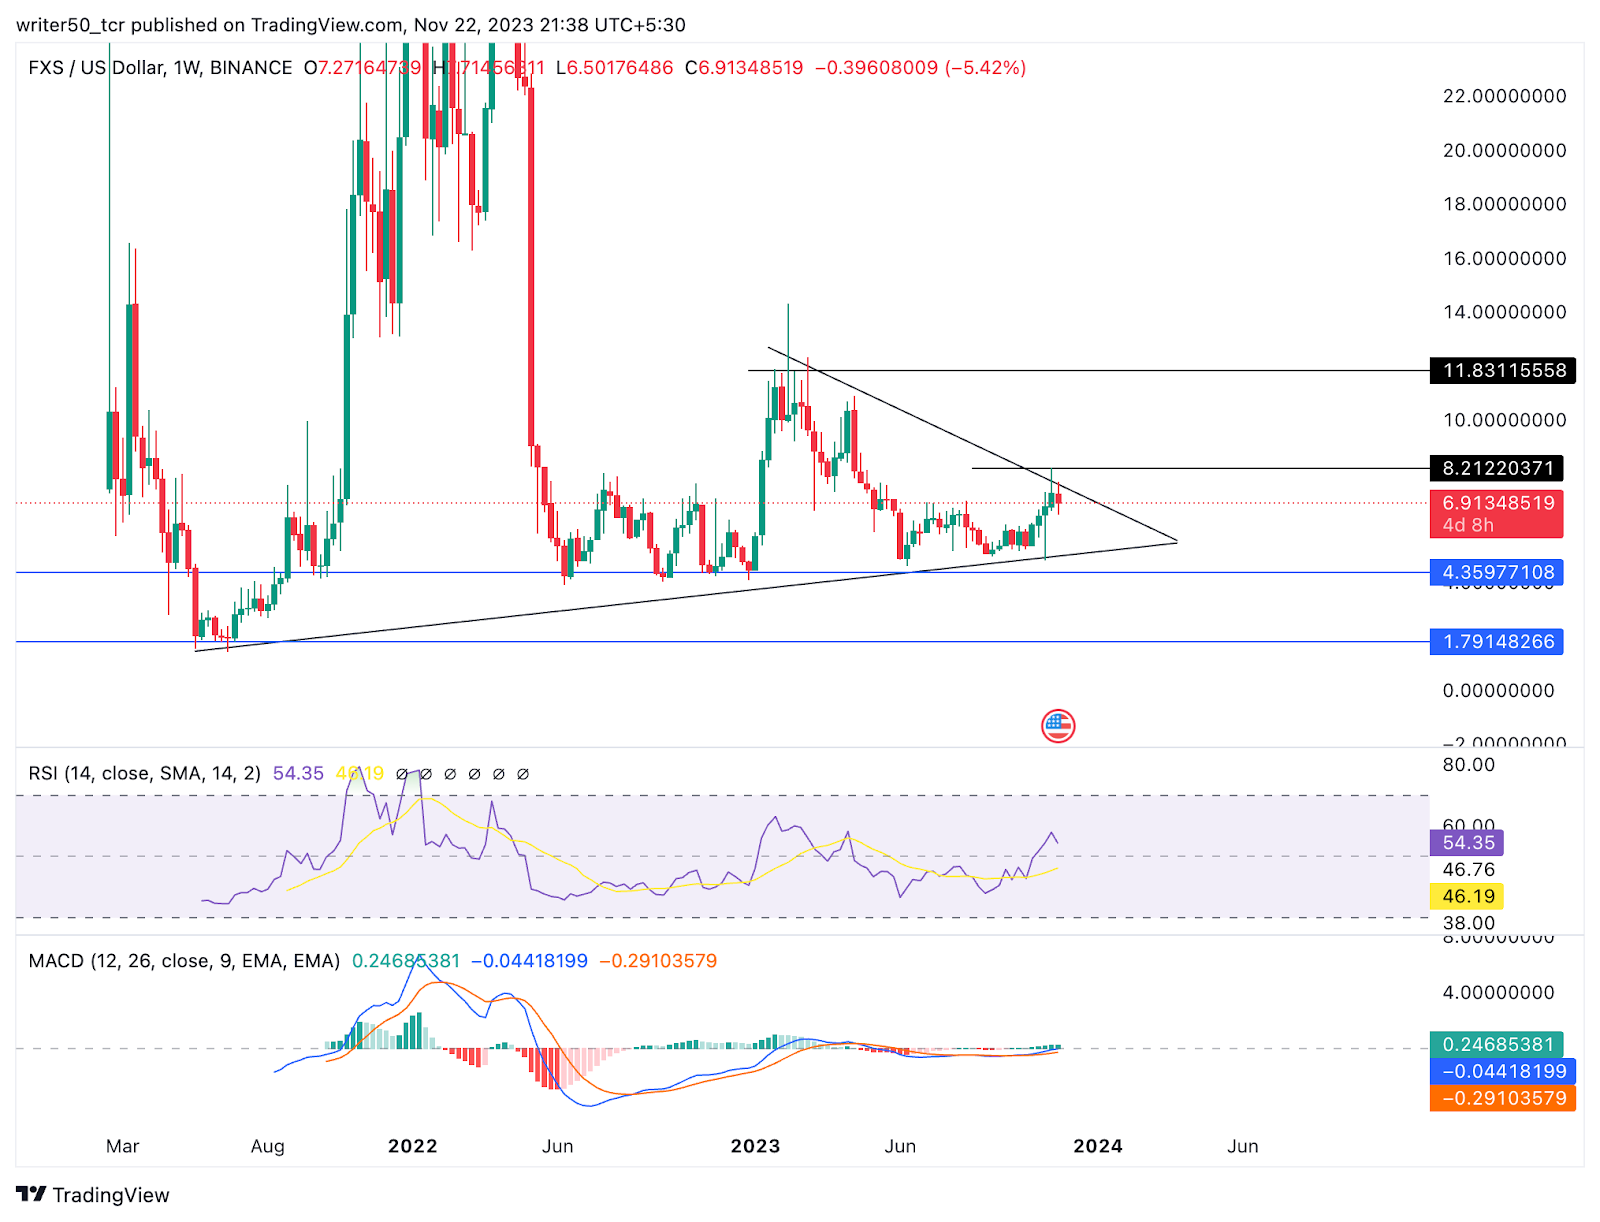
The Frax share is moving in an uptrend. The FXS coin is rising by forming a higher high pattern.
After reaching an all-time high, the Frax Share coin experienced a 90% decline. However, it discovered support at the $4.35 level. Remaining in a sideways movement for over a year and a half, the price action has formed a triangle pattern.
Currently trading close to the resistance level, the coin exhibits a positive overall structure. A breakthrough above the resistance level could lead to further upward movement in the upcoming days.
Technical Indicators Summary
The MACD line of the FXS coin is above the signal line, signaling a potential price rise.
Additionally, the RSI line is at the 54 level, with the SMA line near 45, indicating a positive signal for an expected bullish trend in the coming days.
Conclusion
In conclusion, the FXS coin is moving upwards, with the formation of a positive pattern. The coin’s value is increasing over the year and the volume is witnessing a rise. The overall structure of the coin is positive and the price is expected to increase if it breaks above the resistance level.
Technical Levels
- Support Levels: $4.3 and $1.79
- Resistance Levels: $8.21 and $11.8
Disclaimer
The views and opinions of the author, or anyone else in this article, are for informational purposes only. They do not offer financial, investment, or other advice. Investing or trading crypto assets involves the risk of financial loss.




