
 Quack AI
 NEAR Protocol
 Monero
 Lighter
 Ethena
 Pons
Pons Sui
Sui
- The CTK coin price found support at the $0.40 level and reversed.
- The one-week return of the CTK coin is over 7.00%.
Shentu Chain is a blockchain utilizing a security-centric delegated proof-of-stake consensus mechanism. It emphasizes reliable execution for critical applications like DeFi, NFTs, and autonomous vehicles.
The chain places a high priority on cross-chain compatibility, designed as a Cosmos Hub with complete compatibility with EVM and Hyperledger Burrow.
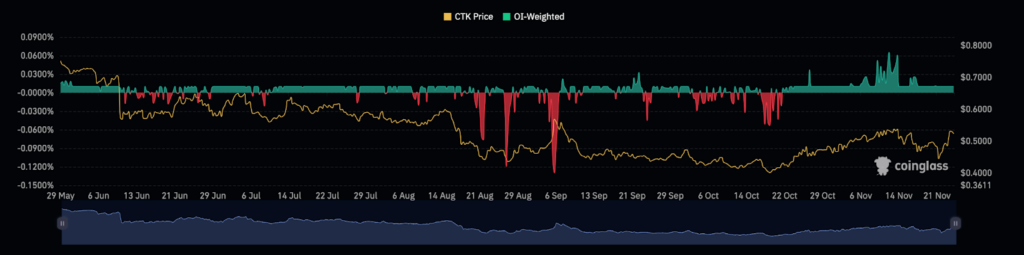
Financials of the CTK Coin:
The CTK coin has shown a weekly return of over 7% and the one-month return of the token is 17.38. It displays an impressive recovery by the coin.
The total trading volume of the CTK token is $13.67 Million and it has shown an increase of 41.7% in the last 24 hours. It brings the volume/market cap ratio to 0.10.
The 52-week low and high of the CTK token are $0.39 and $0.99 respectively. The coin is ranked #436 as per the market rank.
Technical Summary by TradingView
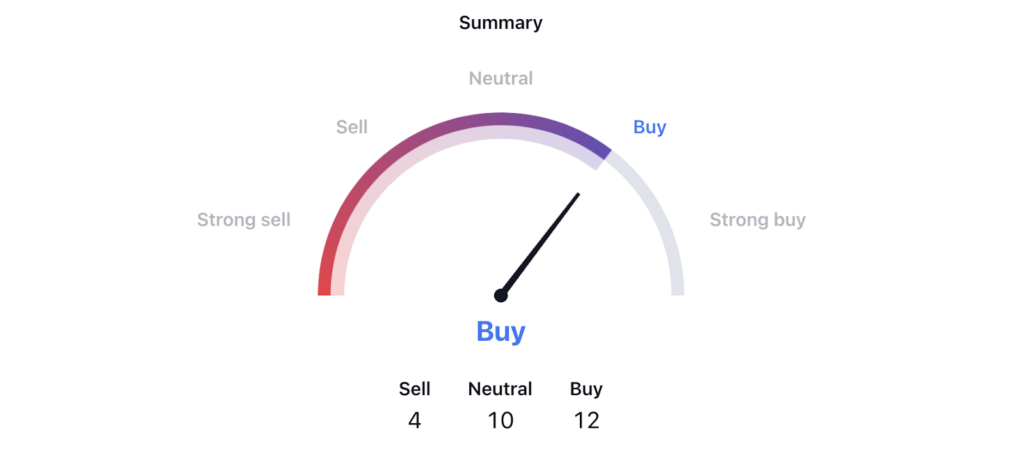
According to TradingView’s technical summary tool, the CTK token is signaling a buy. Among the 26 indicators, 12 are bullish, while only 4 are bearish. It strengthens the bullish sentiment in the market.
Shentu (CTK) Technical Analysis
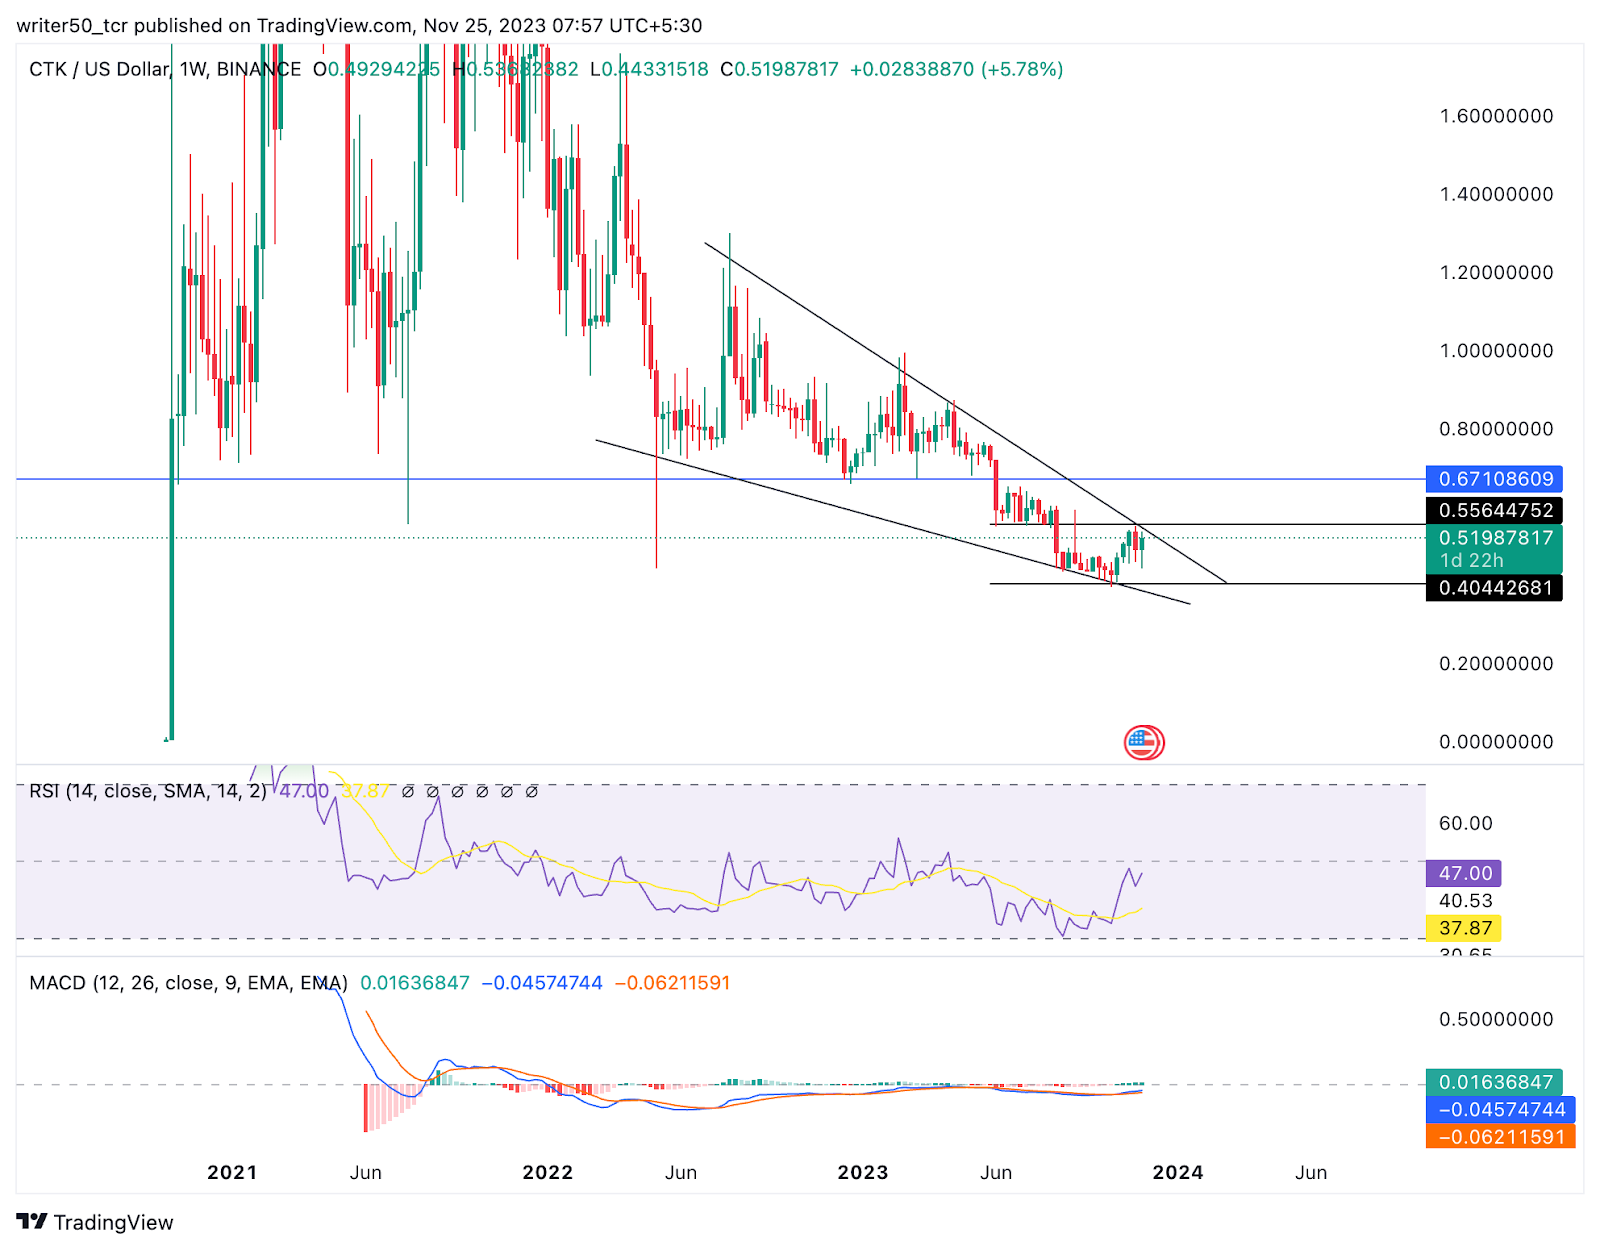
The CTK coin reached a peak of $0.99 in April 2021, experiencing a subsequent decline of over 85%. However, it found support at the $0.40 level, leading to a reversal in the market trend.
The price action has formed a falling wedge pattern and the coin is currently trading within it near the resistance level. The overall indicators suggest a potential upward movement and a break above the resistance level at $0.55 could indicate further upward momentum.
Technical Indicators Overview
The MACD line for CTK suggests a strong scenario, with the MACD trading above the signal line and forming a green histogram, signaling a bullish pattern.
Furthermore, the RSI line is maintaining proximity to the 47 level, staying above the SMA line. The coin has experienced a positive crossover, indicating a potential upward movement in the upcoming days.
CTK/USD Live Chart by Tradingview
Conclusion
In summary, the CTK coin shows signs of an upward trend as the price moves within a falling triangle pattern, displaying positive returns in recent months. Additionally, the increasing volume and positive indicators suggest that if the price breaks above the triangle pattern, further upward movement may occur soon.
Technical Levels
- Support Levels: $0.40 and $0.30
- Resistance Levels: $0.55 and $0.67
Disclaimer
The views and opinions of the author, or anyone named in this article, are for informational purposes only. They do not offer financial, investment, or other advice. Investing or trading crypto assets involves the risk of financial loss.




