
 Celestia
 Pearl
Pearl Quantus
 Zcash
Zcash Hyperliquid
 Aerodrome Finance
 NEAR Protocol
- The FORT coin is respecting the support level, showing a gain of .44% today.
- It is showing an advance of 29.05% in the previous month.
- The technical indicators are showing a bullish signal for the FORT coin.
Forta serves as a decentralized, community-driven monitoring network designed for real-time detection of threats and anomalies in blockchain activities related to DeFi, NFTs, governance, bridges, and other Web3 systems.
Forta is built upon a decentralized network of autonomous node operators responsible for scanning transactions and block-by-block state alterations to identify outlier transactions and potential threats.
If it detects issues, node operators promptly dispatch alerts to subscribers, empowering them to proactively address potential risks.
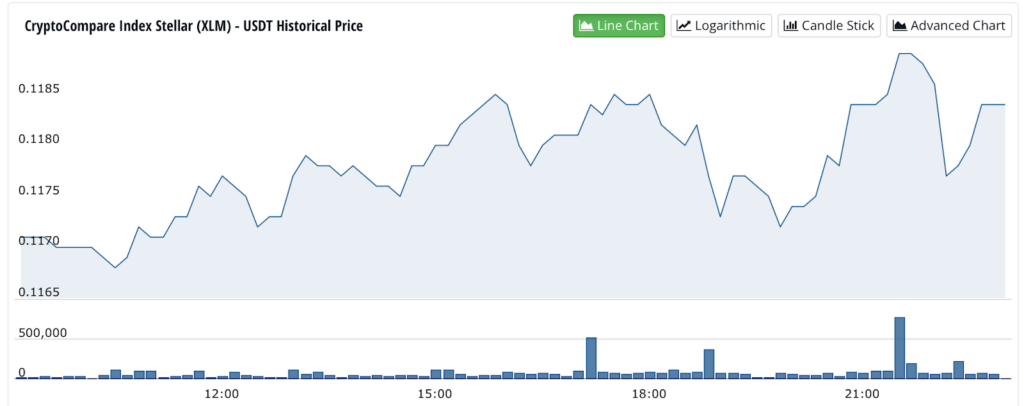
Financials of the FORT coin
The current live price of Forta (FORT) is $0.125646, with a 24-hour trading volume of $313,012. We provide real-time updates for the FORT to USD price. Over the last 24 hours, Forta’s native has experienced a 3.72% increase.
As of now, it holds the #456 position on CoinMarketCap, boasting a live market cap of $48,799,553. The circulating supply of FORT coins is 388,388,554 with a maximum supply capped at 1,000,000,000 FORT coins.
Forta (FORT) recorded its all-time low at $0.084456 on October 20, 2023. As of now, the current price reflects a 50.52% increase from this historical low.
Technical Summary by TradingView
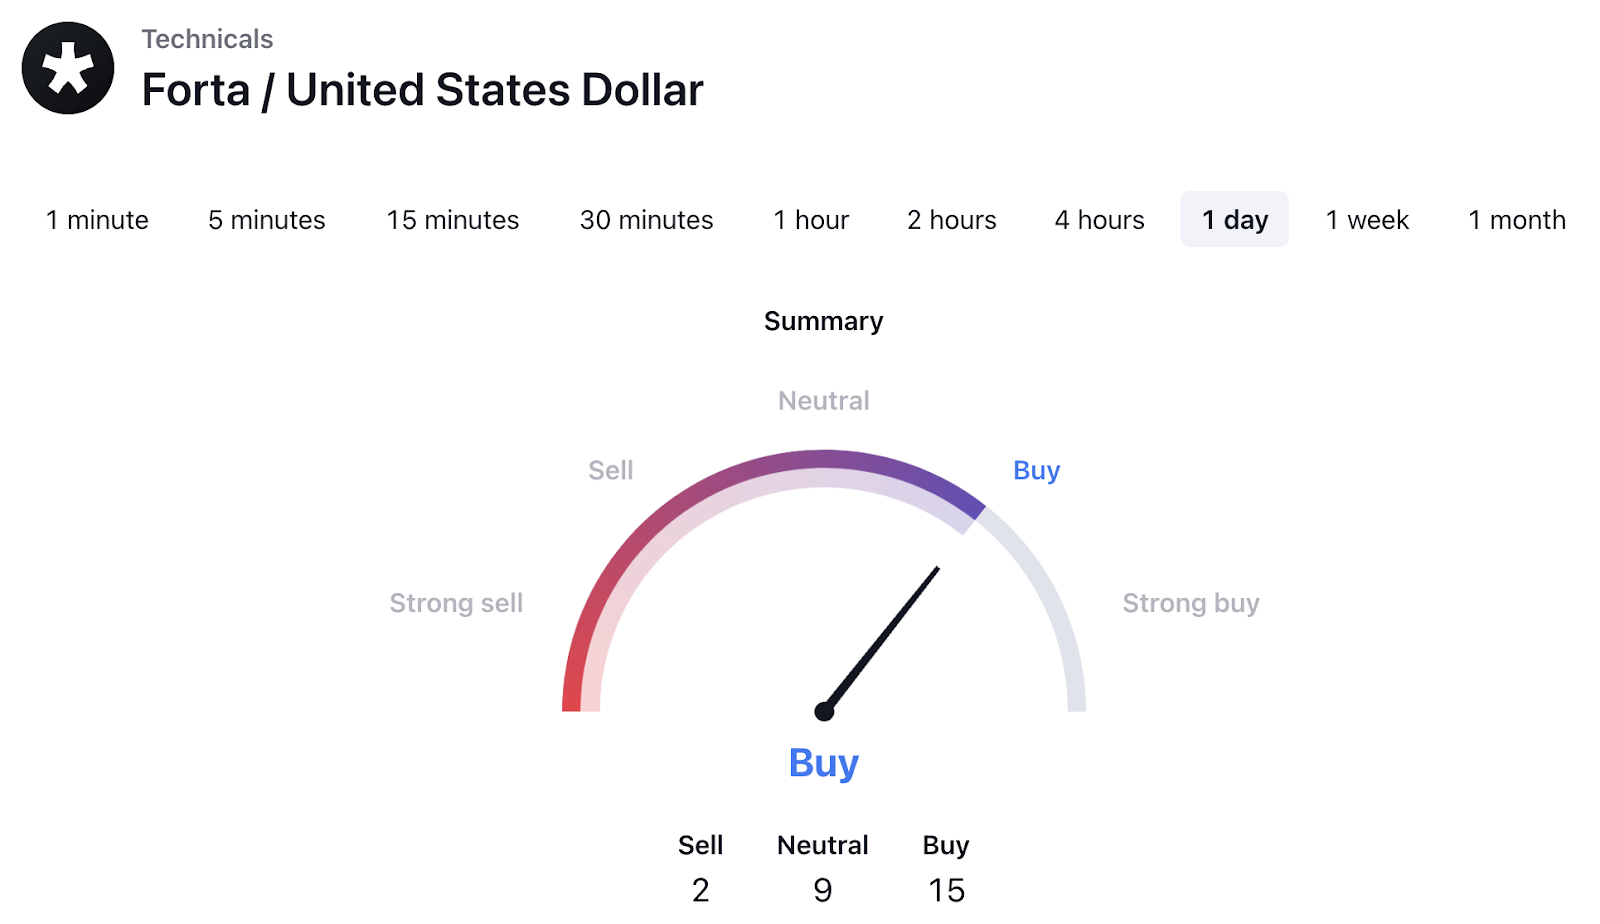
As per the technical summary tool on TradingView, the FORT coin is indicating a buy. Out of the 26 indicators, 15 are suggesting a bullish signal, while only 2 are bearish. This reinforces the prevailing bullish sentiment in the market.
Forta Coin (FORT) Technical Analysis
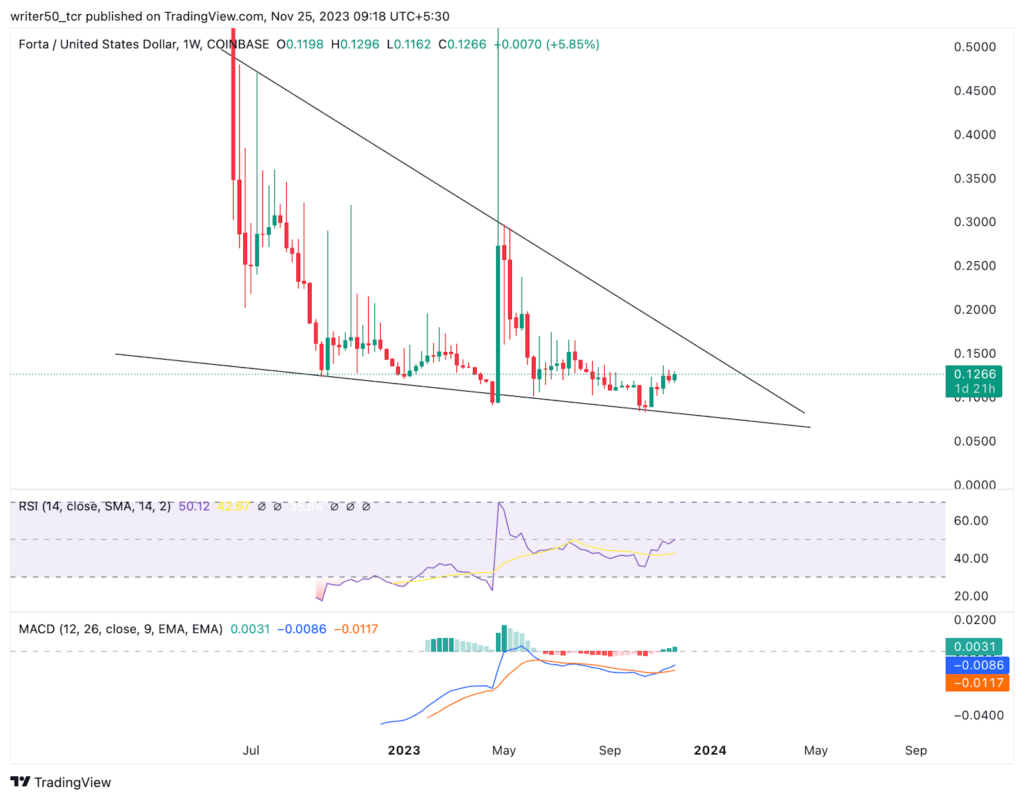
The FORTA coin found support at the $0.8 level, after experiencing a substantial decline of more than 89%. Presently, the coin is following a descending wedge pattern, displaying adherence to the support level.
The coin has initiated a reversal, demonstrating a recovery of over 50%, signaling the emergence of bullish momentum. A further upward movement is anticipated if the price continues to show an uptrend move and breaks out of the wedge pattern, indicating potential higher levels in the near future.
Technical Indicators Overview:
The MACD line for FORT suggests a strong scenario. With the MACD trading above the signal line and forming a green histogram, it signals a bullish pattern.
Furthermore, the RSI line is maintaining proximity to the 47 level, staying above the SMA line. The coin has experienced a positive crossover, indicating a potential upward movement in the upcoming days.
FORT/USD Live Chart TradingView
Conclusion
In conclusion, indications point towards an upward trend for the FORT coin. The coin price is navigating a descending triangle pattern and showcasing positive returns over recent months. The rising volume and positive indicators suggest that a breakout above the triangle pattern could lead to further upward movement in the days ahead.
Technical Levels
- Support is: $0.08 and $0.05
- Resistance Is: $0.15 and $0.19
Disclaimer
The views and opinions of the author, or anyone named in this article, are for informational purposes only. They do not offer financial, investment, or other advice. Investing or trading crypto assets involves the risk of financial loss.




