
 streamoors
 IGNITION
 Injective
 NEAR Protocol
 Quantus
 Pearl
Pearl Aerodrome Finance
- The MANA crypto is witnessing flat trading volume and a slight decline.
- The Decentraland has witnessed higher long liquidation followed by the last 24 hours.
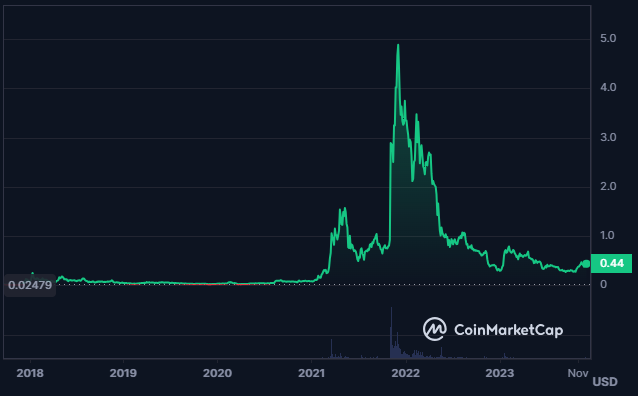
Decentraland is a VR platform powered by Ethereum that lets users create and monetize 3D content. Users own LAND tokens that represent virtual parcels of land. Users can also buy and sell items with MANA tokens. Decentraland is governed by a DAO that allows community voting.
The market cap of the MANA crypto with the decline in the coin price has witnessed an advance of 0.26%. Following this, the spot trading volume of MANA crypto has witnessed a decline of 19.40%.
The current market volume ranking in the cryptocurrency market of MANA token as per Coinmarketcap is #65. The market cap of the MANA crypto is $829.262M and the market cap rank is 62nd, following a market cap dominance of 0.053%.
The MANA crypto also has a fully diluted market cap of $960.6M, derived from a circulating supply of 1.893B MANA and the max supply of the crypto is indefinite.
MANA Sales Analytics
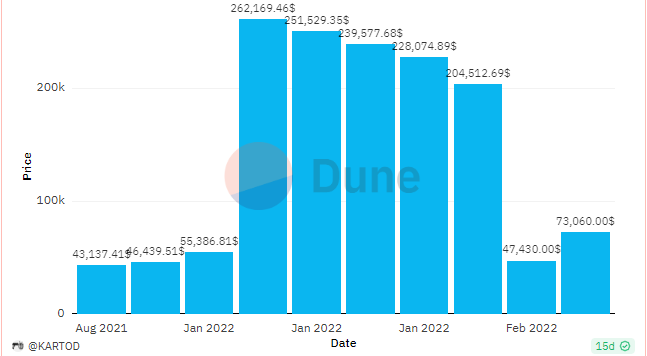
The MANA reported the highest sales of tokens in January in the year 2022. It resulted in a total value of $262.16K. The current reported floor price of the crypto is 0.33 ETH, resulting in $688.05 in USD. There are a total of 5,772 holders currently and 86.4K collection assets.
MANA Crypto Technical Analysis
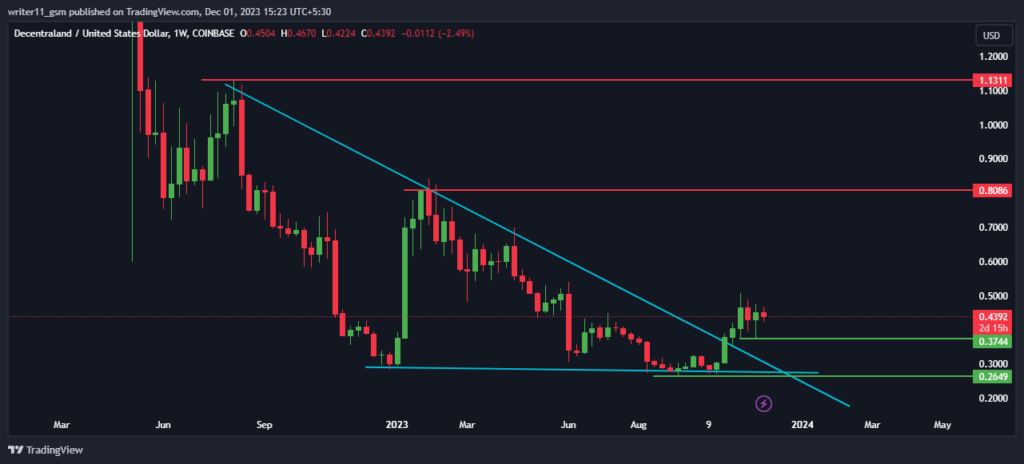
The MANA crypto has broken out above the descending triangle pattern after consistently declining to lower levels. This behavior of the crypto price shows that the buyers are entering into the market and might take over the price.
MANA/USD Chart by TradingView
The MANA crypto price has risen above the 50-day and the 200-day EMAs, forming a bullish golden cross. It shows that the price trend is positive and strong as the EMAs are also rising to higher levels with the crypto price.
The MACD is also positive and suggests a possible price increase as the lines are above the zero level. However, the signal line is lower than the MACD line, which implies a potential pullback in the MANA token price.
Conclusion
The MANA coin is in a strong bullish trend and has a high chance of reaching new highs. The price has broken above the descending triangle pattern and the key moving averages, indicating a positive momentum and trend. Therefore, the MANA crypto is a good investment opportunity.
Technical Levels
- Support levels– $0.2700 and $0.3740
- Resistance levels– $0.8270 and $2.8245
Disclaimer
The views and opinions stated by the author or any other person named in this article, are for informational purposes only and do not constitute financial, investment, or other advice. Investing in or trading crypto or stocks comes with a risk of financial loss.




